What makes a good database is its ability to recover from crashes and mistakes by users or dba's, redo data is used to recover from these types of mishaps. I have already discuss redo in my Oracle section, but in section I go into a little more depth and were it fits in the Oracle Data Guard Environment.
Recovery deals mainly with redo data that recovery can use to reconstruct all the changes made to the database, it's like a replay. Below are the important concepts and components of Oracle recovery
- Redo change vectors - a change vector describes a single change to a single data block
- Redo Record - a collection of redo change vectors that describe an atomic change, atomic meaning all changes are successful not successful
- System Change Number (SCN) - it describes a point in time and is very important, when a transaction starts its reference point for database consistency is relative to the SCN of when it started, the SCN increases when a transaction is committed. The SCN is stored in the redo log, controlfiles and data files headers.
- Checkpoint - A point in time when all items are of a consistent state, all recovery is bounded by the database checkpoint, there are thread checkpoints (local checkpoint), database checkpoint (global checkpoint) and a datafile checkpoint (stored in the datafile header).
- Online Redo Log - simply known as redo logs, ORL files contain persistently stored changed redo records, the records are stored in SCN sequential order, that is the order when the redo was written. When are redo logs are full they are archived to the archived redo logs.
- Archive Redo Log - Archived versions of redo logs, this files are deemed inactive and are located in the archived destinations.
Most databases including Oracle's are protected by the ACID properties which state that when a transaction is started it must follow these basic rules
- Atomicity - the entire sequence of actions must be either completed or aborted, it cannot be partially successful, basically all-or-nothing.
- Consistency - the transactions moves from one consistent state to another
- Isolation - a transactions effects or changes are not visible to other transactions until the transaction is committed
- Durability - changes made by the committed transaction are permanent and must survive a system failure
Remember these rules apply to all databases not just Oracle, ACID provides the guarantee of reliability and consistency of a database. I have also discussed ACID in my Oracle 10g section called transactions.
There are three types of failures
- Transaction - See my Oracle 10g Transactions for more details
- Instance - this is were the database instance fails (SGA and buffer cache are lost)
- Media - the loss of one or more database files
So what really happens when you create a transaction as it generates its changes and produces redo, and the log writer process (LGWR) flushes to disk, a good understanding goes a long way to helping you resolve problems
- When a session is about to make a change to the data blocks via DML it must first acquire all the buffer cache locks (exclusive locks)
- The redo describes the change (change vectors) are generated and stored in the processes PGA
- The redo copy latch is obtained (memory lock) and while holding this the redo allocation latch is also obtained. After successfully acquiring the redo latch space is then allocated in the redo log buffer. Once space is allocated the redo allocation latch is released as it may have high contention
- The redo generated can be copied from the processes PGA into the redo log buffer, on completion of the copy the redo copy latch is released
- The session foreground can now safety tell the LGWR to flush the redo log buffer to disk, the database blocks may have not yet updated with the DML changes, at this time the buffer cache buffers are updated
- The LGWR flushes the redo buffers to the ORL and acknowledges the completion to the session, at this point the transaction is persistent on disk, so far no commit as occurred yet
- At some point into the future the database buffers that were previously changed will be written to disk by the database writer process (DBWR) at checkpoint time.
Note that before the DBWR process has flushed the database buffers to disk, the LGWR process must have already written the redo buffers to disk, this is because of the write-ahead logging protocol which states that no changes appear in the datafiles that are not already in the redo log.
Eventually the transaction will be committed which allocates a SCN and undergoes the same transaction life cycle steps as above, the commit guarantees that the redo previously generated is propagated to disk, this is know as log-force commit.
Components of a Physical Standby
As mentioned in the architecture it can be categorized into three major components
- Data Guard Redo Transport Service - used to transport the redo generated by the primary to the standby
- Data Guard Apply Service - receives and applies the redo sent by the redo transport services to the standby
- Data Guard Role Management Services - assist in database role changes in switchover and failover scenarios
The over picture looks like below
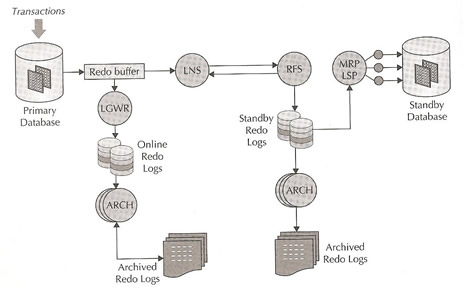
There are a number of Oracle background processes that play a key role, first the primary database
- LGWR - log writer process flushes from the SGA to the ORL files
- LNS - LogWriter Network Service reads redo being flushed from the redo buffers by the LGWR and performs a network send of the redo to the standby
- ARCH - archives the ORL files to archive logs, that also used to fulfill gap resolution requests, one ARCH processes is dedicated to local redo log activity only and never communicates with a standby database
The standby database will also have key processes
- RFS - Remote File Server process performs a network receive of redo transmitted from the primary and writes the network redo to the standby redo log (SRL) files.
- ARCH - performs the same as the primary but on the standby
- MRP - Managed Recover Process coordinates media recovery management, recall that a physical standby is in perpetual recovery mode
- LSP - Logical Standby Process coordinates SQL apply, this process only runs in a logical standby
- PR0x - recovery server process reads redo from the SRL or archive log files and apply this redo to the standby database.
Standby Redo Logs were introduced for the following reasons
- Data Protection - if SRL files are not used incoming redo is not kept if the connection to the primary is lost, when a failover occurs the data being sent at the time of the disconnect is lost. However if that redo data was written to an SRL file, it is persistent and available when the failover occurs
- Performance - In older versions the LNS process had to wait while the RFS process created and initialized the archive log on the standby before the LNS/ARCH could start sending redo. This could cause problems if the log file was large, as this event occurs at switchtime the impact on the primary could be high. In the newer version LNS in ASYNC mode will not inhibit the LGWR log switch but could it could potentially impact how far behind the standby could get after a log switch.
SRL files are configured on both the primary and the standby but are on active on the standby until a switchover/failover occurs. They should be configured as the same size as the ORL files, it is also recommended to have n+1 SRL files per instance defined on the standby, where n is the number of redo log members per thread on the primary site.
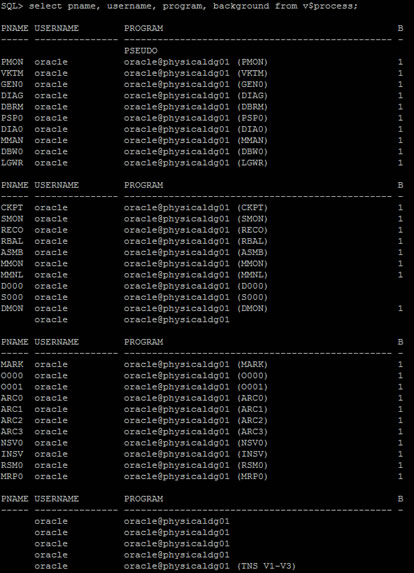
Here is a list of the all the processes running on the standby
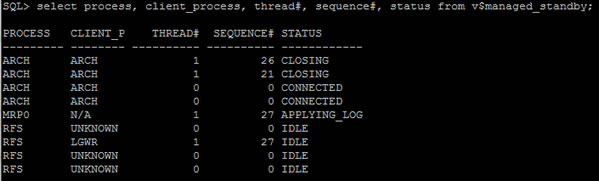
and the list of redo processes
Lets carry on the life cycle of a transaction with the content of Data Guard being added to the equation, we left off with the LGWR just flushing off the redo to the disk, we are going to presume that we have ASYNC and he RTA is configured
- The LNS process reads the recently flushed redo from the redo buffer and sends the redo stream to the standby using the defined transport destination (LOG_ARCHIVE_DEST_n), since this is ASYNC the LGWR does not wait for any acknowledgement from the LNS process
- The RFS on the standby reads the redo stream from the network and writes it to the redo stream buffers to the SRL.
- The ARCH process on the standby archives the SRLs into archive log files when a log switch occurs at the primary database , the archived log is then registered with the standby control file.
- The actual recovery process involves three phases
- Log read phase - the managed recovery process (MRP) will asynchronously read ahead the redo from the SRL of archived redo logs (this only occurs if the recovery process falls behind), the blocks that require redo apply are parsed out and placed into appropriate memory map segments
- Redo apply phase - MRP ships the redo to the recovery slaves using the parallel query (PQ) interprocess communication framework. Parallel media recovery (PMR) causes the required data blocks to be read into the buffer cache and subsequently redo will be applied to these buffer caches buffers
- Checkpoint phase - this phase involves flushing the recently modified buffers to disk and also the update of data file headers to record checkpoint completion.
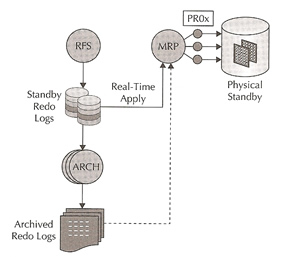
The whole process above is continuously repeated until recovery is stopped or a role transition (switchover/failover) occurs. With real-time apply when redo is received by the RFS on the standby, the process writes the redo to the archived redo logs or optionally to the SRL, in some cases the redo rate becomes too high and the apply process in unable to keep up with real-time, in this case the MRP (or LSP) automatically performs the redo apply using the archived log files when it has caught up the apply will again resume real-time apply using the SRL files, a diagram of the whole process is below
To enable real-time apply
| Enable real-time apply |
sql> alter database recover managed standby database using current logfile disconnect; |
| Determine if real-time apply is enabled |
sql> select recovery_mode from v$archive_dest_status where dest_id = 2;
RECOVERY_MODE
--------------------------
MANAGED REAL-TIME APPLY |
You improve performance regarding real-time by trying to tuning the following
- Increase the size of the ORL and SRL files so that a log switch occurs at a minimum of 15-minute intervals
- Use the parallel option I managed recovery (see below for more information)
- Implement real-time apply
- Increase DBWR I/O throughput by setting disk_async_io=true by default it is set to true
- Use Oracle new feature Calibrate_IO which allows you to gauge the overall I/O throughput on the server
- Increase the buffer cache sizes especially db_cache_size
Parallel Media Recovery (PMR) allows you to keep up with the primary database, the MRP process will perform a scan of the redo logs and parse and build redo change segment maps, this is easily handled by the MRP process, once the map is build the apply process can begin and this is where parallelism occurs. In Oracle 11g the PQ slave problem in 10g has been solved by leveraging Oracle kernel slave process (KSV), these can be seen as PR0x processes, the MRP process uses these kernel processes to perform the actual recovery, the PR0x process will hash to a segment map, read from this map, and apply the redo to the standby database. The number of PR0x process is dependant on the number of CPU's in the system.
Tools and Views for Monitoring
There are a number of tools and views that are useful to identify the status and performance problems, first we start with Data Guard views
| Background processes |
select process, client_process, thread#, sequence#, status from v$managed_standby;
|
| Information on Redo Data |
select * from v$dataguard_stats;
Note: this indirectly shows how much redo data could be lost if the primary db crashes |
| Redo apply rate |
select to_char(snapshot_time, 'dd-mon-rr hh24:mi:ss') snapshot_time,
thread#, sequence#, applied_scn, apply_rate
from v$standby_apply_snapshot;
Note: this command can only run when the database is open |
| Recovery operations |
select to_char(start_time, 'dd-mon-rr hh24:mi:ss') start_time,
item, round(sofar/1024,2) "MB/Sec"
from v$recovery_progress
where (item='Active Apply Rate' or item='Average Apply Rate'); |
You can use Oracle's statspack which you should be familiar with if you have ever used Oracle before, this can be used on the primary to collect data and store performance data from the standby database, however the standby needs to be opened for read only which does require an additional license because you would have to use Active Data Guard.
Follow below on how to setup statspack for a standby database
| statspack for the standby database |
# This is the newer version of statspack, all the scripts should reside in $ORACLE_HOME/rdbms/admin
- create the schema which involves running the sbcreate.sql script, this will create the standby statspack schema on the primary database, you need to have the following information ready
- A password for stdbyperf
- Default Tablespace
- Temporary tablespace
- Define the standby database, connect to the primary database as user stdbyperf and execute the sbaddins.sql script
sql> connect stdbyperf/password
sql> @sbaddins.sql
You will be asked for the following and the script will also perform the following
- The TNS alias of the standby database instance
- The password of the perfstat user on the standby site
- The script will add the standby database to the statspack configuration
- Create the private database link to the perfstat schema on the standby site
- Create a separate PL/SQL package for each defined standby database
- Create statpacks snapshots, while the standby is in read-only mode, login to the primary database as the stdbyperf user and execute the snapshot
sql> connect stdbyperf/password
sql> exec statspack_Prod1DR.snap
Most of the statspack is the same but play particular to two reports regarding the standby database
- Recovery progress stats
- Managed standby stats
|
There are a number of scripts that can be used regarding statspack
- sbreport - generates the standby statistics report
- sbpurge - purge a set of snapshots
- sddelins - deletes instances from the statspack configuration
- sbdrop - drops the stdbyperf user and tables
- sdaddins - add standby instances to the statspack configuration
Physical Standby Corruption Detection
Although this is a Oracle 11g feature it can be used with standby databases, Oracle has a number of components that detect data block corruption (see my database corruption section for further information), the corruptions are recorded in the view v$database_block_corruption, you can create an alert in Enterprise Manager to let you now of any new corrupted data blocks, you can enable an internal mechanism to provide even better data protection by setting the parameter db_ultra_safe to true. This parameter includes the following checks
- Detects redo corruptions
- Provides checksum and internal metadata checks
- Ensures redo is "next change" appropriate to data block
- Detects lost writes and data block corruption
- Validates data block during reads and after updates
- Detects data block corruption through checksum during reads and through db_block_checking after DML block operations
- If ASM redundancy is in use, it enforces sequential mirror writes on ASM-based datafiles.
By setting the parameter db_ultra_safe, you are setting the parameters db_block_checking, db_block_checksum and db_lost_write_protection., however this parameter does have a performance impact depending on the numbers of changes from 1-10% and it will be higher on a physical standby than the primary.
Physical standby databases redo apply mechanism implicitly verifies redo headers for correct format and compares the version of data block header with the tail block for accuracy, when db_block_checksum is set it compares the current block with the calculated value, checksums catch most data block inconsistence's, it also validates more internal data block structures such as Interested Transaction List (ITLs), free space and used space in the block.
When the db_lost_write_protection is set to typical on the primary database, the database log buffer cache reads and for read-write tablespace's in the redo log; however when the parameter is set to full the instance also logs redo data for read-only and read-write tablespaces., when set on either typical or full a physical standby database the instance performs lost write detection during media recovery.When set to typical on either the primary or the physical database, the primary will record buffer cache block reads in the redo log and this information can be used to detect lost writes in the standby database, this is done by comparing SCN versions of the blocks stored on the standby with those in the incoming redo stream, if a block version discrepancy occurs, this implies that a lost write occurred on either the primary or the standby database.
Lost writes occur during a hardware failure (disk, HBA), these can go undetected for a while they are silent corruptions. If the block SCN on the primary database is lower on the standby database it detects a lost write on the primary and throws an internal error (ORA-752), to recover you must failover to the standby and re-create the primary. If the SCN is higher it detects a lost write on the standby and throws an internal error (ORA-600 3020), to repair you must re-create the standby database or affected files.
Oracle recommends that you should set the parameter db_lost_write_protect to typical, this is the greatest protection but has the minimum impact on your databases, you you want the best protection but don't mind having a performance hit then set db_ultra_safe to true.