SAP MaxDB Overview
In this section we cover a lot of ground detailing SAP MaxDB architecture. You will also learn about the most critical database parameters which are useful for the day to day administration of MaxDB
Please note that this section covers the following versions
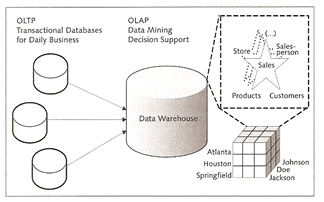
OLTP (Online Transactional Processing) systems are the preferred databases to be used in processing daily activities and are consequently optimized for fast processing, they handle large number of concurrent users and very large volumes of data, as the name suggests it is mainly used for transaction applications.
OLAP (Online Analytical Processing) is an analysis technology that provides information for efficient enterprise planning in an intuitive way. This concept was first introduced by the inventor of the relational data model Dr. Edgar F. Cobb and describes a multidimensional view of the data. OLAP systems are supported by "integrated, time-dependent and non-volatile data" from a data warehouse. After the data has been obtained and formatted it can be evaluated in a multidimensional analysis. During this process the data is loaded from OLAP systems into the data warehouse at regular times.
A star schema is used as the database schema for data warehouse applications, it consists of a fact table and multiple (n) dimension tables. Cubes (OLAP cubes) are usually used to map these multidimensional business key figures. Data can be aggregated or mapped in detail at different aggregation levels for example drill down, roll up, or the dimensionality can be reduced using conditions (slice and dice). The snowflake schema extends the star schema by classifying and normalizing the dimension tables. This way, an explicit hierarchy is setup, which results in structured data but may also lead to increased query times.
MaxDB uses a relational database to physically store the OLAP data, this is called Relation OLAP (ROLAP), this process is very efficient at handling very large volumes of data.
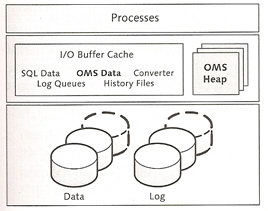
SAP liveCache technology stores essential portions of data in the cache and hard disk space is used only for security-relevant operations. The liveCache architecture is divided into a hard disk space area, a main memory area and a finally a process area.
The table below provides the individual memory areas and the special features used
| I/O Buffer cache | The I/O buffer is largest area in memory, it is divided into the following areas
|
| OMS data | This area occupies the largest area in the I/O buffer cache, ideally all data is stored in main memory |
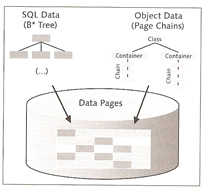
| Pages | The I/O buffer cache is divided up into pages (by default 8K in size), that are connected via pointers. Each page may contain multiple objects of the same class and several pages may contain objects of the same class. The latter grouped using page chains and are assigned to a container (see below picture)
|
| Object identifier | The system accesses the object data via an object identifier (OID), this identifier includes the logical page number for the localization in memory, a position index (slot) for the localization within the page, and a version indicator for reusing the object identifier. |
| OMS heap | this also occupies a portion of main memory, the OMS heap includes local copies of the OMS data and thus can be considered the private cache of the OMS. You can control the heap using the following parameters
If the OMS heap is not divided then the entire heap is locked when a database procedure requests or releases memory. |
| Garbage collectors | these are part of the user kernel thread and delete no longer needed undo log files as well as the corresponding database objects. The are enable during the following
The released pages are reassigned to the I/O buffer cache via free memory management. |
SAP MaxDB primary consist of the database manager server (DBM server), the database server and the database instance needs to be installed on the same host. There are tools which allow you to access the database server remotely, these are known as the client tools.
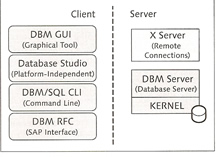
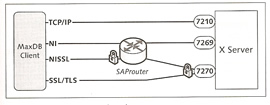
The database manager receives commands from clients and instructs the database kernel to execute these commands, if the client and server are on the same host then they can directly communicate; otherwise the client connects to the XServer via the standard port 7210, the XServer then forwards the commands onto the DBM server.
You can use a SAP router to access a XServer, the router can use either a non-secured or a secured protocol to access the XServer, see the diagram below for an example on how this is setup
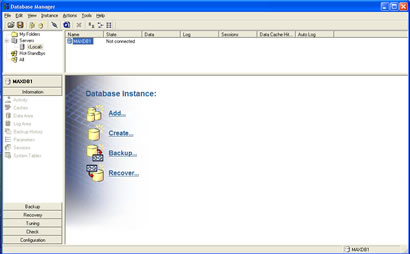
There are two GUI tools that allow you to administer the database, it depends on what version of SAP MaxDB you are using
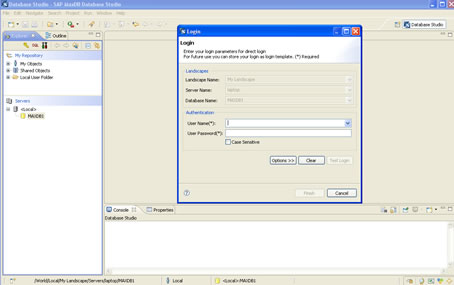
The Database Studio is the newer version and provides the same function as the DBMGUI but with lots of additional functionality. It uses a JDBC connection to the X Server even if on the same host.
The new DB Studio is based on the eclipse framework, so if you have used Eclipse before it will be very familiar.
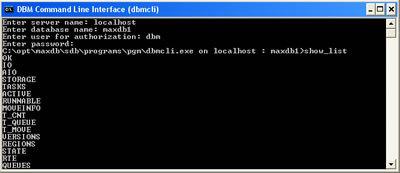
You can also use a commandline interface called dbmcli to access the database
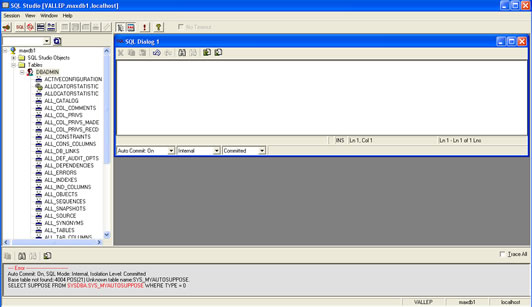
Lastly there is a tool that allows you to run SQL commands against your data, this is called the SQL Studio, there is also a commandline version called sqlcli.
As you can see above SAP have created some great tools to administer and maintain your database, here is a quick recap
| Administering | There are 2 ways to administer the DBM
|
| SQL access | There are three ways to access the database
|
SAP have also a number of tools that allow you check, monitor, collect statistics, etc. I have detailed them below and we will be covering them in greater detail in later sections.
| /opt/sdb/programs/bin/x_cons | this utility is used to obtain detailed information on the database. It can also be called remotely using the dbmcli command. this tools can obtain information and perform certain tasks
|
| /opt/sdb/programs/bin/xuser | You can store logon information into a file that allows a simplified logon process (does not ask a password). Think of it as a kind of ssh where you can set it up so that you don't need to supply a password. |
| dbanalyser | This tool is built into the database manager GUI, it is used for performance tuning and is a great tool, setup it up to collect information for a interval period and then it will log what it thinks are performance problems with the database, for an example scan tables problems, I/O problems, etc This is a great tool and a must for all DBA's, I will be going into greater detail in another section on performance tuning. |
| /opt/sdb/programs/bin/xinstinfo | This tool outputs the directory structure of the specified instance that you give to it. Use this tool if you get path related errors to make sure that the setup is correct. |
| /opt/sdb/programs/bin/x_ping | This tool allows you to check remote database connections and to check response times as well. |
| /opt/sdb/programs/bin/dbmget | display files from the server on the client, for example you may what to display the kernel messages file, this will allow to to do that |
| /opt/sdb/programs/bin/sdbregview | Display information on the installed packages |
| /opt/sdb/programs/bin/getdbroot | display the root path of a database instance on a host |
There are three types of users
| SQL User | These users can only access the data, basically normal users. |
| Administrator User | These users have certain administration rights to access, it is created during installation and is called "DBADMIN". It can perform the following
|
| SYSDBA User | Is basically both a SQL User and a Administrator User |
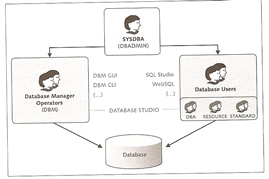
Database operators can have a number of rights and privileges, all are accessible via the GUI.
There are three different types of SQL users
| DBA | can create other SQL users, create SQL objects, assign privileges |
| RESOURCE | can create tables, views and database procedures. It can also create database objects and manage the user rights of the objects it created. |
| STANDARD | can only access data, which means it can only access tables, views, stored procedures for which it has access to. |
SAP MaxDB also uses the concept of roles, you assign the rights to roles and then the roles to users.
When you install MaxDB a standard set of users are created for a SAP system
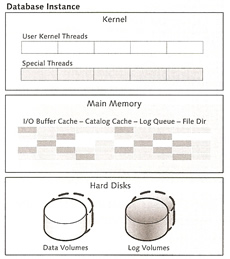
The MaxDB database is divided into three area's
| Kernel | this is mapped by a process that is divided into several threads. The kernel threads are divided into user kernel threads (UKTs) and special threads. The runtime environment relates to the structure of the threads. |
| Main Memory | Data is temporary stored in main memory via caches. This is because memory is faster than disk accesses to retrieve data. |
| Hard Disks | This is the physical storage units which are divided into logical volumes called data volumes and log volumes. |
The kernel thread is divided into several threads which in turn are divided again. you can display the threads using the dbmcli command or the x_cons command
/opt/sdb/programs/bin/dbmcli -U <user> -d <database> -c show rte
/opt/sdb/programs/bin/x_cons
x_cons> show rte
Special Threads |
|
| Coordinator thread | This is the first thread started, it reads the memory and process configuration of the database instance and starts the corresponding threads basis of the imported parameters and monitors them, if any errors the coordinator thread can stop them |
| Requestor thread | this thread receives client logons and assigns them to a UKT task |
| Console thread | enables you to monitor the kernel via the x_cons program. It stores critical messages in the KnlMsg (knldiag) file |
| Timer thread | used for time-dependent control processes |
| Dev threads | the term comes from the old devspace concept, the new version uses volumes. They are responsible for reading and writing to the data and log volumes. The number of threads is determined by the number of volumes, each is two per volume and one for the writing of the kernel trace. dev 0 plays a critical role as it coordinates and monitors the other dev threads. If a volume is no longer available then dev 0 will stop the threads for that volume, likewise if additional volumes are added then dev 0 will start the threads for that volume. |
| Asdev threads | these threads are used for backups and are started when required |
| I/O Worker threads | are used when you use the asynchronous I/O implementation of the operating system, because user kernel threads directly call the operating system interface, these threads wait for and receive the response |
| Diagram | 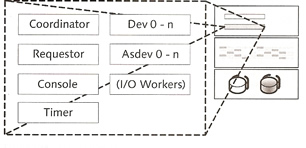 |
User Kernel Threads (UKTs) |
|
| UKT | these threads coordinate the execution of tasks and assign CPU time to them or give them control to the process job If you have a server with multiple CPUS then the below formulas should be used to set the parameter MAXCPU MaxDB only |
There are a number of tasks the database will perform
| User Tasks | When a user or application requests a connection exactly one user task is assigned to it. There is a limit to the number of tasks defined by the parameter MAXUSER-TASKS, thus you can control the upper limit. You can limit individual user tasks and there stack size by using the parameter _MAXTASK_STACK |
| Server Tasks | Server tasks are responsible for
The parameter MAXSERVERTASKS is used to control the number of parallel tasks running, the tasks can block each other but using the parameter ALLOW_MULTIPLE_SERVERTASK_UKTS will using multiple CPUs if the server has them |
| Additional Tasks | There are a number of additional tasks
|
Tasks are bundled by user kernel threads and are managed via cooperative multitasking by default. The operating system can't affect how the database tasks are distributed across user kernel threads (UKTs), which means that it is possible that one UKT may become 100% utilized while another CPU is idle. Also using cooperative multitasking can also result in one long task blocking all other tasks in the same UKT.
The timer thread implements load balancing and distributes the tasks across corresponding UKTs, the timer thread checks the wait time of the individual tasks of a UKT and adds them to calculate the overall UKT wait time. If there are considerable deviations in the individual UKT wait times, the timer thread moves the waiting task of a UKT with a high waiting time to a UKT with a lower waiting time.
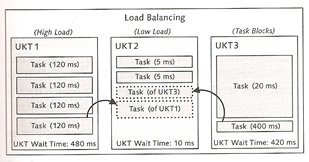
The parameter LOAD_BALANCING_CHK to activate or deactivate load balancing by default it is deactivated
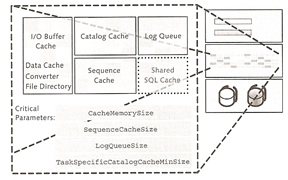
Caches are used to temporary store data retrieved from the data volumes (physical disks), this is to increase performance memory is a lot fast than disk. The objective of a DBA is to keep the most used data in cache, thus keeping the user happy.
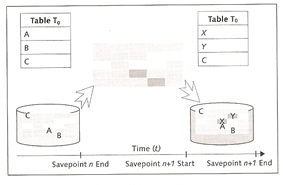
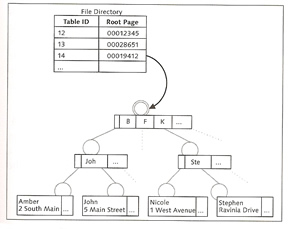
The I/O buffer cache is divided into three areas: data cache, converter and file directory. MaxDB uses a shadow page mechanism ( or shadow page table). The basic concept of shadow storage is to maintain two versions of each changed information, an old consistent version in the "shadow" and a new inconsistent version. In other words when you change data during a transaction the changed data is written to a new location.
Shadow copies are based on savepoint cycles, this maps the writing of changes that have been made by users from data cache (main memory) to data volumes since the last savepoint was made. In this process the data is not overwritten but copied into free memory areas. This enables you to restore a consistent status of the database using the last completely saved savepoint in the event that the savepoint operation fails unexpectedly. Only at the end of a savepoint cycle, that is, when the last savepoint is completely saved in the data volume, does the system release the obsolete data of the previous savepoint for overwriting.
Now back to the I/O buffer cache and the converter, which maps data pages to physical pages, the system imports the converter into the converter cache when the database starts. If the system fails to find a page number in the data cache, it searches the converter cache to calculate the physical position of the data page in the data volume. At each savepoint the system writes the content of the converter cache to the data volume and assigns a version number. Each converter version maps a consistent status of the database.
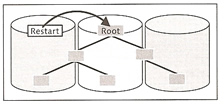
The converter is implemented as a B*tree in the data storage and is distributed across all data volumes. It can be read from multiple devices at the same time and copied into the converter cache. The B*tree consists of three levels, root level, index level and the leaf levels. The root level is stored in the first data volume (restart area) which stores the position of the converters root page (see below diagram).
The size of the converter page is 8K and the page can manage 1,861 data pages of a data volume. Each converter entry contains the assignment of a logical page number to a physical data page and the data page type. There are three different types
Type |
Description |
P |
Permanent data page |
T |
Temporary data page |
S |
Data page of an SAP livecache database |
For an example "173921 P 2/0002683621",
As MaxDB uses the shadow page mechanism there is a possibility that there are two copies a current version an a old version of each data page. It is therefore possible that two converter entries exist for each data page, the physical addresses of the old and the new version.
When you start the database, the entire internal file directory is imported into the main memory, it contains information on the logical access to database objects such as the root page of tables whose logical structure is also stored as a B*Tree. The parameter CACHE_SIZE, can influence the size of converter and data cache.
The state of a table before and after a change has been implemented is also called the before image or after image. When a transaction is active the before image is stored in the data storage and released for overwriting after a COMMIT. The after image is transferred to the log queue and physically stored in the log volume after a COMMIT.
The log queue contains the log entries of the current transactions (redo log entries) and writes them to the log volumes using the log writer. You can define the log queues and their size
A normal transaction would go like this
Catalog Cache, Shared SQL Cache, Sequence Cache
In addition to the user data of a table, the catalog cache contains structure information (the database catalog). The system assigns an area of the catalog cache to each user table, when the database session have finished, the system releases this area. If the catalog cache is full the system stores the information in the data cache. The parameter CAT_CACHE_SIZE controls the size of the catalog cache.
The shared SQL caches holds already executed SQL queries, thus memory is kept to a minimum. two parameters are used to control the shared SQL cache SHARED_COMMANDCACHESIZE and SHAREDSQL.
The sequence cache stores current values of database sequences, use the parameter SEQUENCE_CACHE to control its size.
One note to remember is that a page is 8K in size not 8192, so for example
| Log Queue | Setting the parameter LOG_IO_QUEUE 50 pages x 8K |
Here is a display of my current caches
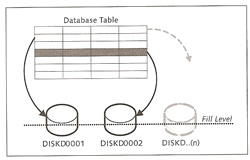
Data volumes mainly store user data for tables, indexes, catalog data, converter data and before images (history pages), The parameter MAXDATAVOLUMES define the maximum number of volumes that can be used, you must restart the database in order to change this value.
Two events will trigger writing to the data volumes
SAP uses the below formula
| Data volume sizing | data volume size = √total size A 50GB would result in eight volumes, because the square root of 50 is eight rounded up. |
SAP balance the I/O of a table because data is striped across all data volumes
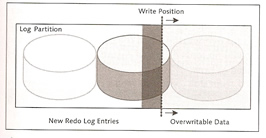
Log volumes contain the after images (redo log entries), the parameter MAXLOGVOLUMES defines the maximum number of log volumes.
Writing to the log volumes is triggered by the following events
There is one log writer for each log partition, however you can have a number of log volumes to one log partition. Log partitions are written cyclically and can only be written over if it has already been saved via a backup, however there is an option that will allow you to overwrite the log entries even if they have no been backed up but never use this is a Production environment.
You can set the system up so that a automatic backup will kick in at a specific threshold, thus you can make sure the logs are backed up ahead of time, there are two strategies that can be used
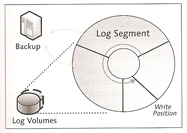
Segments can cover upto 50% of the entire log area, by default the log area is divided into three equal segments but this can be changed using the LOG_SEGMENT_SIZE parameter to configure the segment size, try to size it so that you get at least one backup per day. Note that the database will freeze if a a log becomes full and it requires a backup before it is released.
When a new database is created you need at least one data volumes and one log volume, you cannot change the size of these, but you can add more data and log volumes at runtime. When you add additional data and log volumes there might be a slight degradation in performance as the data is rewritten across all the volumes.
At savepoints, the database writes data changes that have been made from the data caches to the data area (storage) since the last savepoint. Savepoints are automatically write during any of the following triggers
A savepoint always maps a consistent database status, this is due to the shadow storage mechanism and the version numbers, which are assigned successively and thus identify incomplete savepoints. Savepoints have three phases
Savepoint Three Phases |
|
| First Phase | All modified permanent data pages from the data cache to the data area |
| Second Phase |
|
| Third Phase |
|
To increase I/O operations all system resources are dedicated to phases 1 and 3.
A snapshot maps the current state of the data area, once a snapshot has been obtained you can return to the state of the snapshot at any time or copy all the changes since the saved image.
Data is protected by a lock in case two users change the data at the same time, a lock can be either requested implicitly by the database or by the application, there are three types of locks
| Lock Type | Possible Objects | Description |
| Shared Lock | Tables Data Records Database Catalog |
Other transaction retain read access to the database object |
| Exclusive Lock | Tables Data Records Database Catalog |
Other transactions can neither read/write access to the database object, the lock is retained until the transaction is complete (committed or rolled back) |
| Optimistic Lock | Data Records | An optimistic lock ensures only that the transaction that set the lock is informed if another transaction has set an additional lock in the meantime. the system uses version numbers for the data records |
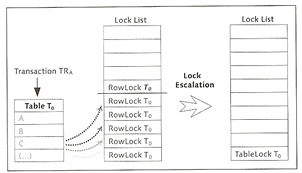
By default when the database is started the isolation level is set to 1, which means for read access to data records, the system ensures that no other transaction is holding an exclusive lock. For write access a exclusive lock is implicitly set which is not released until the end of the transaction (committed or rolled back). A lock list is maintained by the system and the size of this list is set by the parameter MAXLOCKS. If a transaction requests too many locks this may result in lock escalation, yo can define a threshold value using the MAXSQLOCKS, this parameter identifies the percentage of maximum number of locks, after the threshold is hit the system triggers a lock escalation and converts the data records locks into table locks, the locks are only removed when the number of locks is below 20%, it avoid lock escalations increase the size of the lock list.
The directory structure is in three parts
Below contains critical directory paths that you need to know
| <independent_program_path> | shared programs and libraries |
| <independent_program_path>\runtime | runtime environment of the clients i.e. JDBC |
| <dependent _data_path> | installation directory of the version-dependent database software |
| <independent _data_path> | data and configuration files of the database instances and applications |
| <independent _data_path>\config | configuration files for the database parameters and data for user authorization |
| <independent _data_path>\wrk\<database_name> | run directory of the database (configuration and log files of the instances) |
| <independent _data_path>\wrk\<database_name>\data | Data volumes |
| <independent _data_path>\wrk\<database_name>\log | Log volumes |
| <independent _data_path>\wrk\<database_name>\DIAGHISTORY | diagnosis files that save database errors, this can be changes using the DIAG_HISTORY_PATH parameter |
There are four possible states
You can use either of the following to change the database state: DBMGUI, Database Studio or DBMCLI
There is also three variants a kernel can run it
The database parameters are split into three groups
All parameters can be changed when the database is running, but most of them will not come into affect until the database has been restarted. When you change a parameter the parameter configuration file is backed up with a version number you can restore this file using the param_restore command. The configuration file is in binary format, the text file <dependent_program_path>/env/cserv.pcf contains the default values.
the table lists the most important configuration files
| File Name | Path | Description |
| <database> | <indep_data_path>/config | binary file that contains the startup parameters on the instance in question |
| cserv.pcf | <dep_program_path>/env | test file contain the default values |
| dbm.cfg | <indep_program_path> | configuration file for the database manager |
| sdb | /etc/opt | configuration file of the SAP MaxDB software |
| loader.cfg | <loader_app_data>/config | Configuration file of the loader |
| dbanalyzer.cfg | <indep_program_path>/env | configuration file of the database analyzer |
| Previous | Menu | Next |