Distributed Tracing (Sleuth and Zipkin)
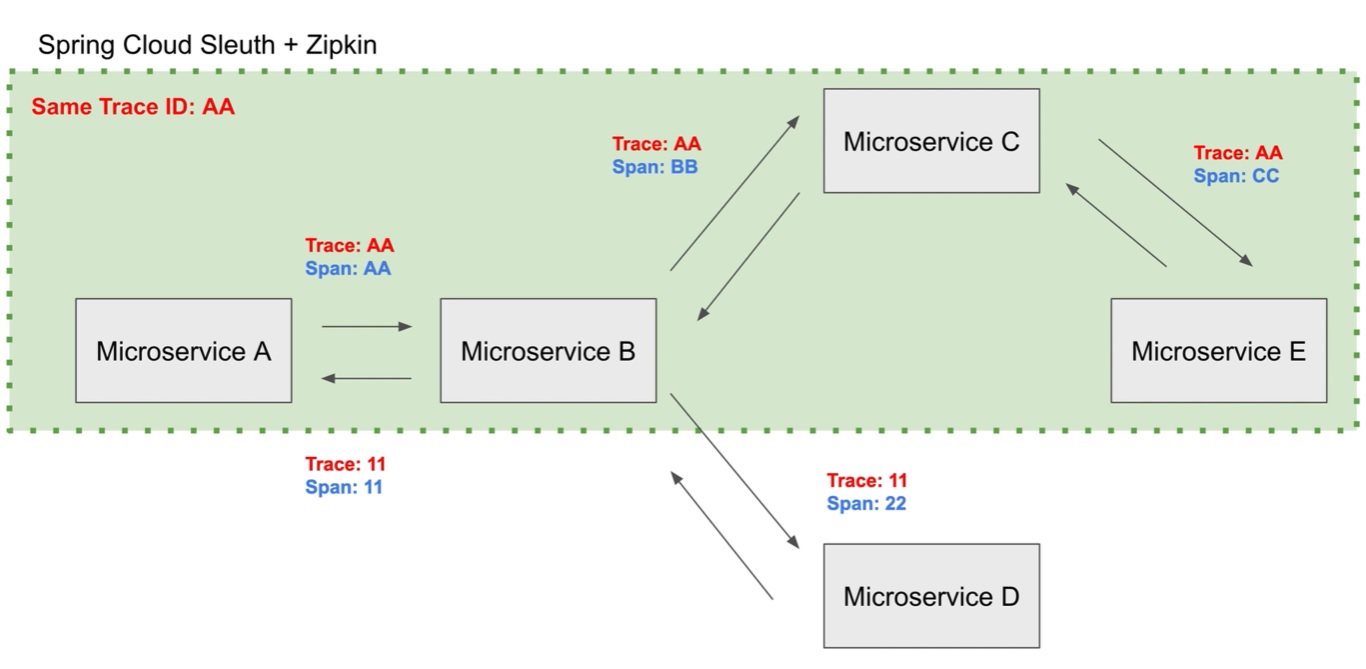
It would be idea if we could trace where mircoservices are having issues or are slowed, or having communication issues, etc, this is were Sleuth and Zipkin can help, basically a trace and span id will be attached and logged enable you to be able to trace a service call, a Zipkin server can then receive these logs and display then in a friendly graphical user interface. The span id will change when the call pass from from microserivce to microservice, the trace id will remain the same and thus you can trace from the original start of the call to the end.
- Sleuth - handles the span and trace id that can be used to trace microservice calls
- Zipkin - receives logs and can display a friendly graphically user interface.
As you can see in the diagram below the trace id stays the same but the span id changes from microservoce to microservice.
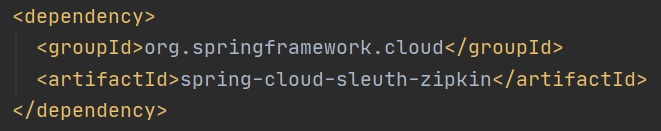
First we need to bring in a dependency as per below
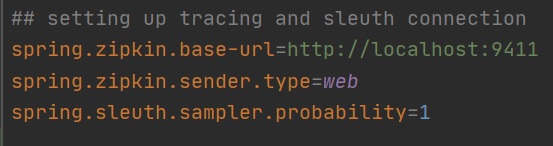
We then need to add some properties regarding the location of the Zipkin log server, the first two properties define the zipkin lcoation and what type of data to send web being HTTP, the last property is what level of detail to send, 0.1 means 10% of infromation will be sent, 1 means 100% of information to be sent.
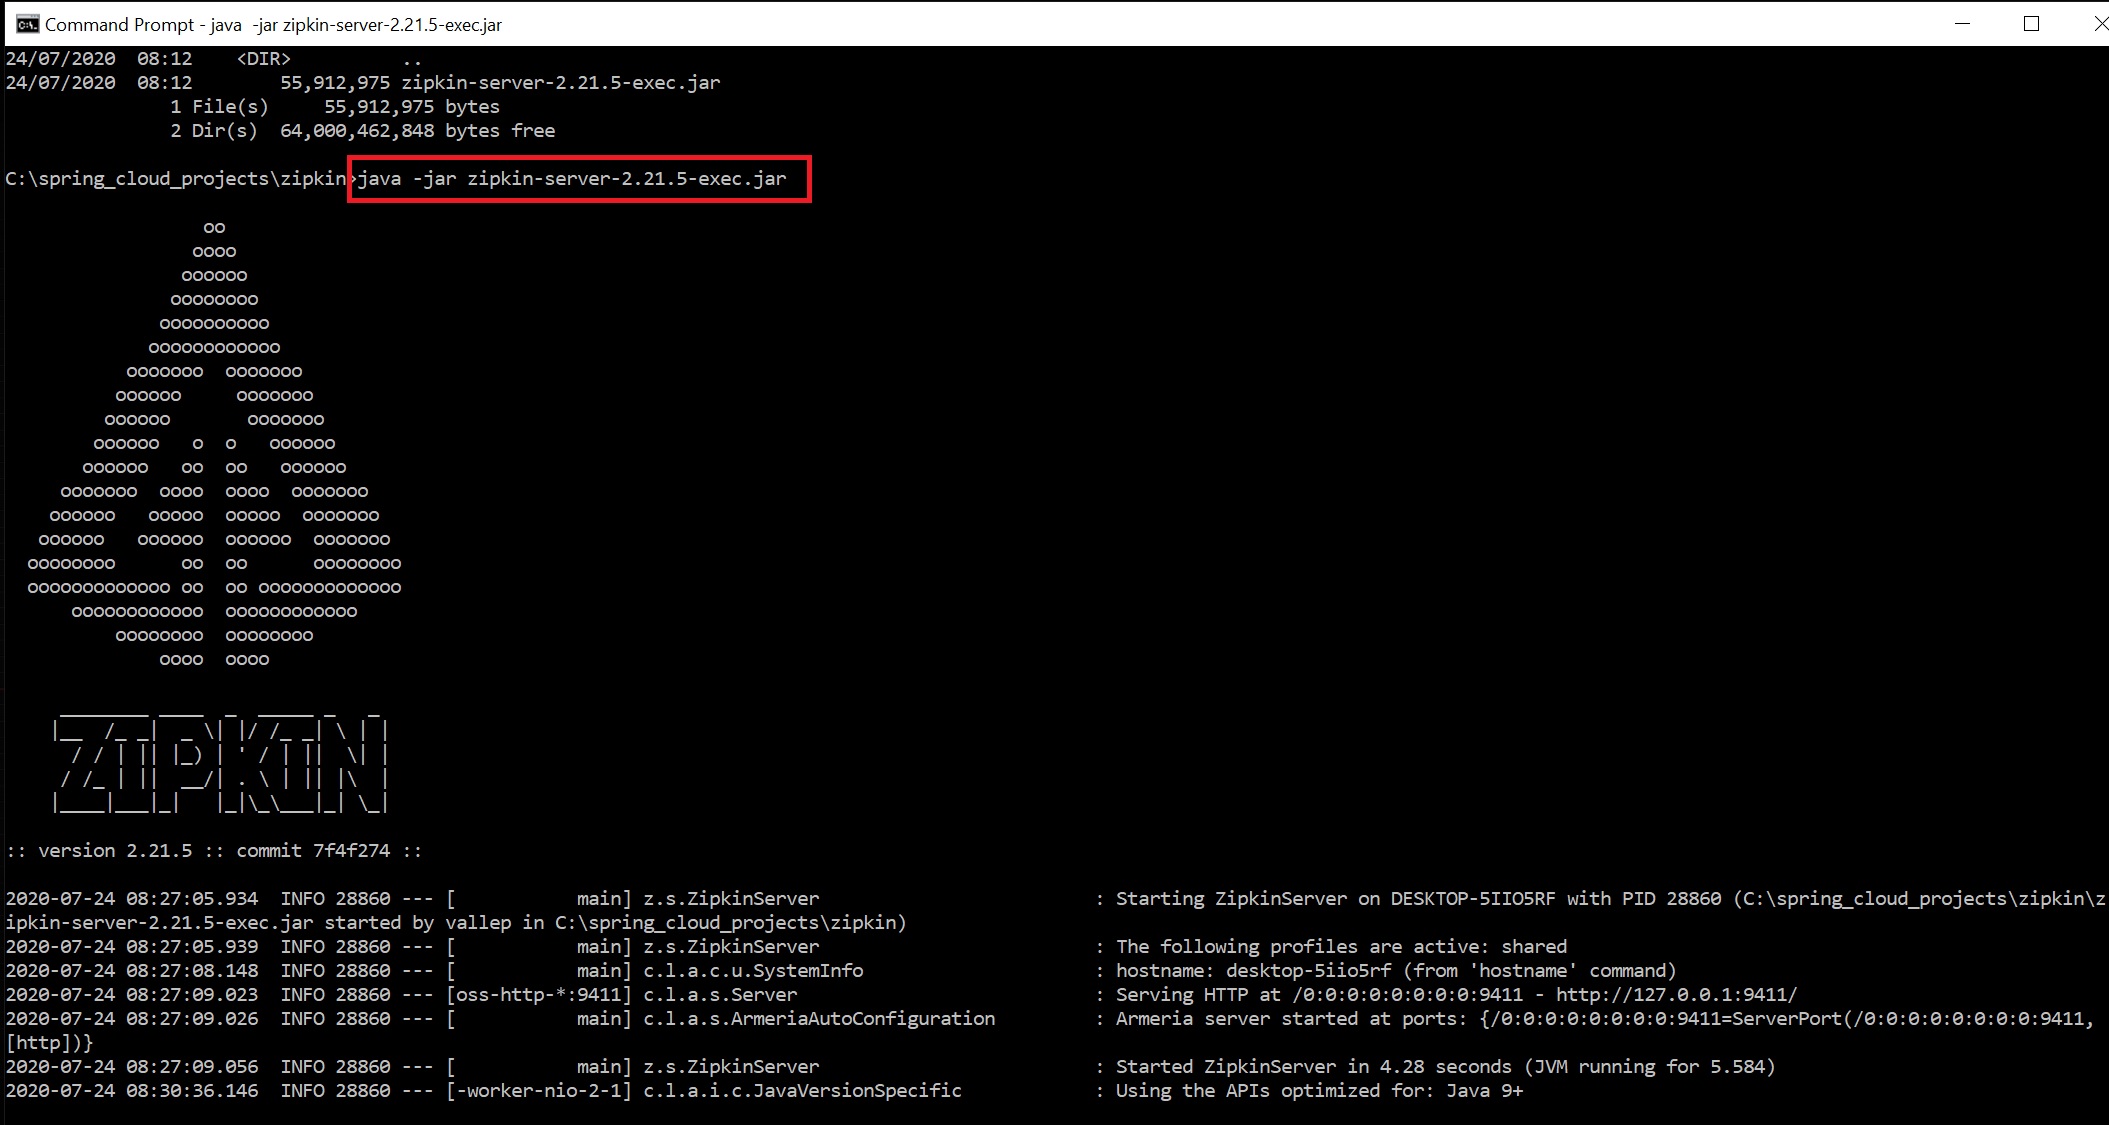
I have downloaded the zipkin server executable and started it on my windows 10 laptop, then restarted the Users application
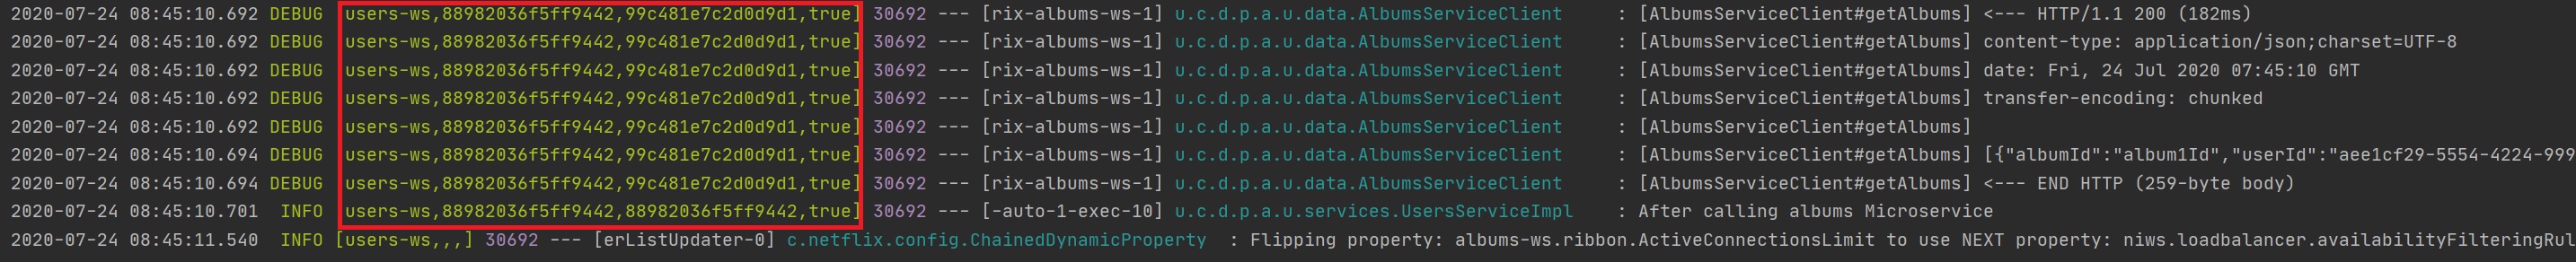
The additional logging can be seen below, the first field is the microservice name, the second field is trace id (the same id will be used) and then we have span id and the last field is if the log information will be sent to the zipkin server.
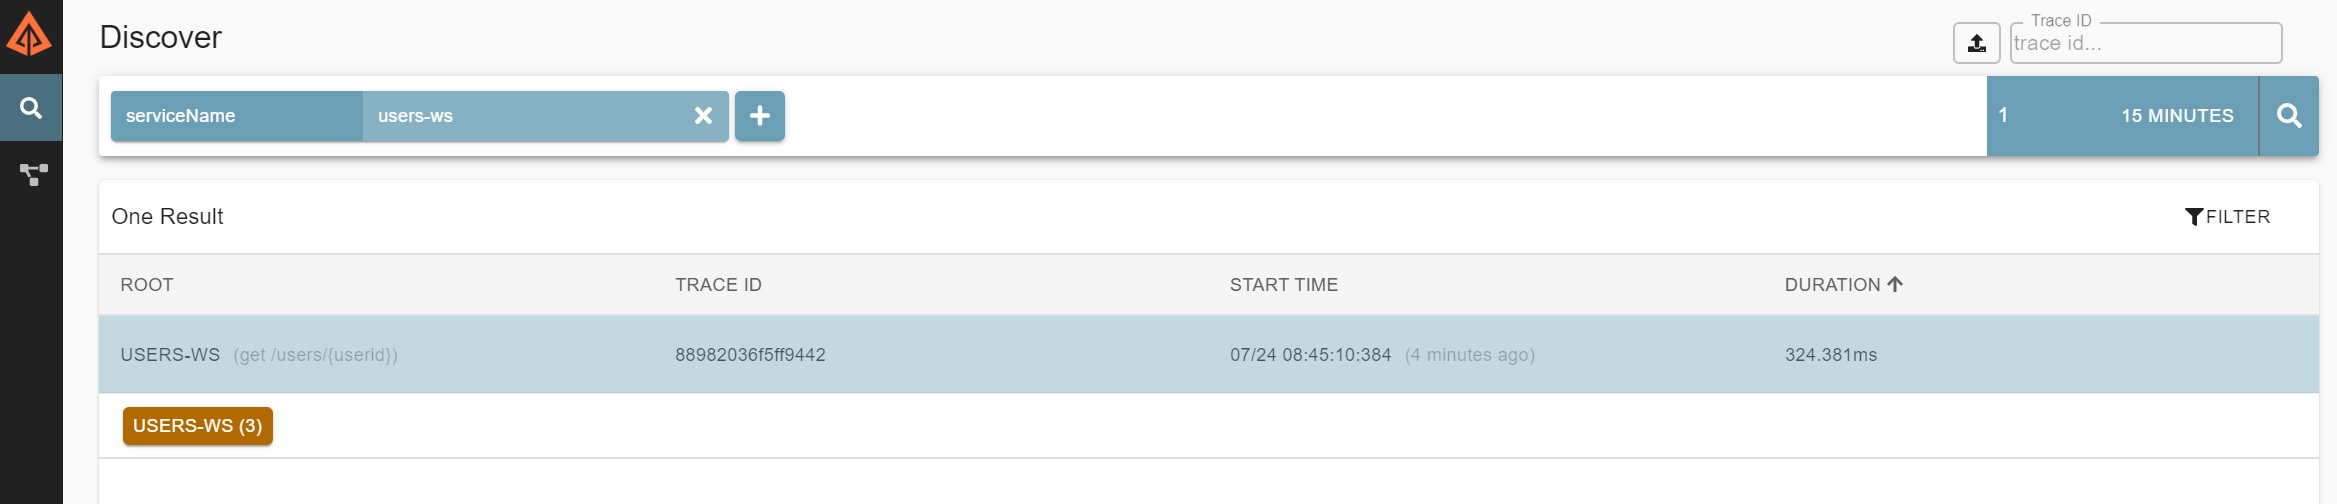
Additonally we can use the zipkin server which will collate all the log information from all the microservices.
  |
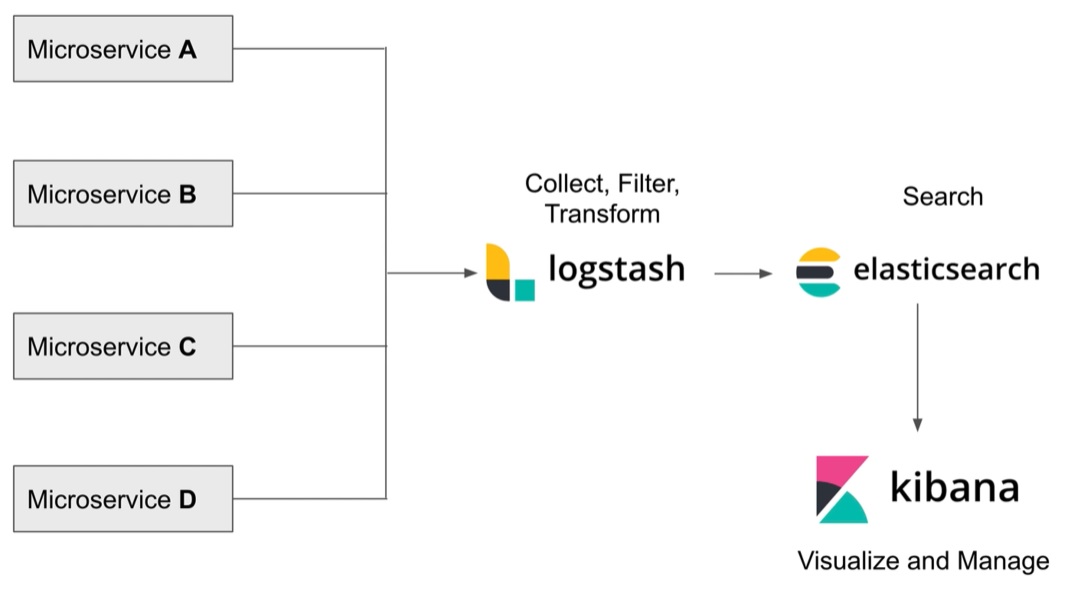
Elasticsearch, LogStash and Kibana (ELK) will aggregate logs files into one central location, basically all the microservices will log to logstash, we can then use elasticsearch to search for specific log entries using the kibana GUI interface.
First we need to add a property file to centralize all the log files from each microservice, as per below
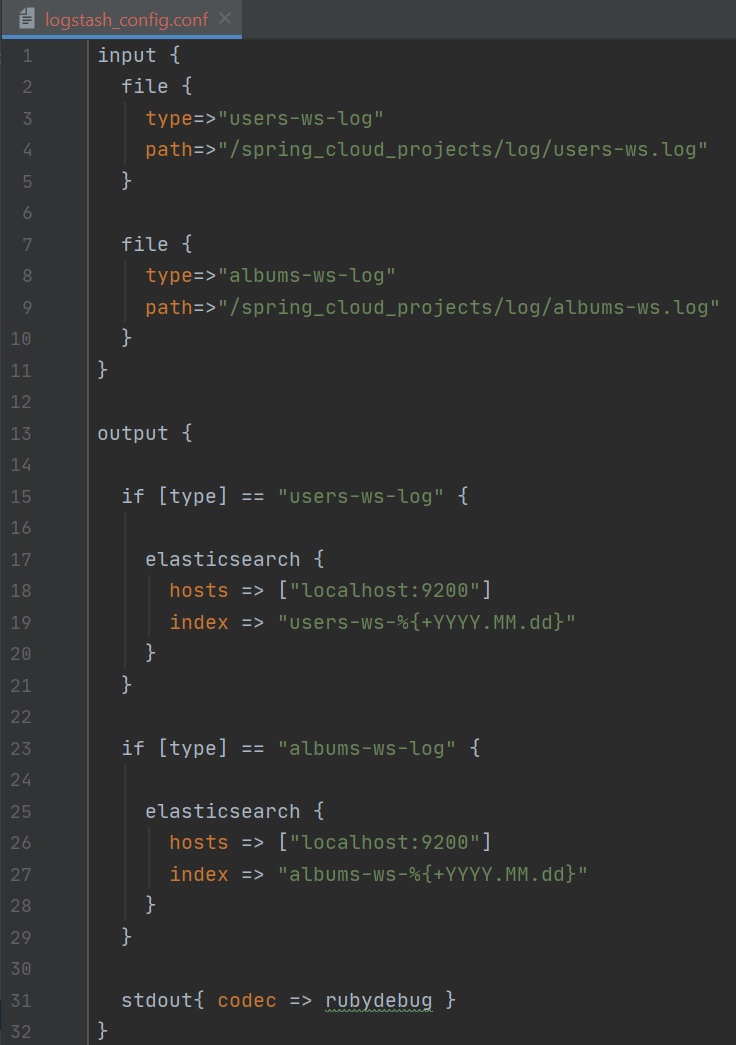
Download logstash and unpack it, in the bin directory we need to create configuration file, that looks like below, we have two inputs which point to the microservices logfiles, which we setup above and a output which is pointing to the elasticsearch server which will be setup below
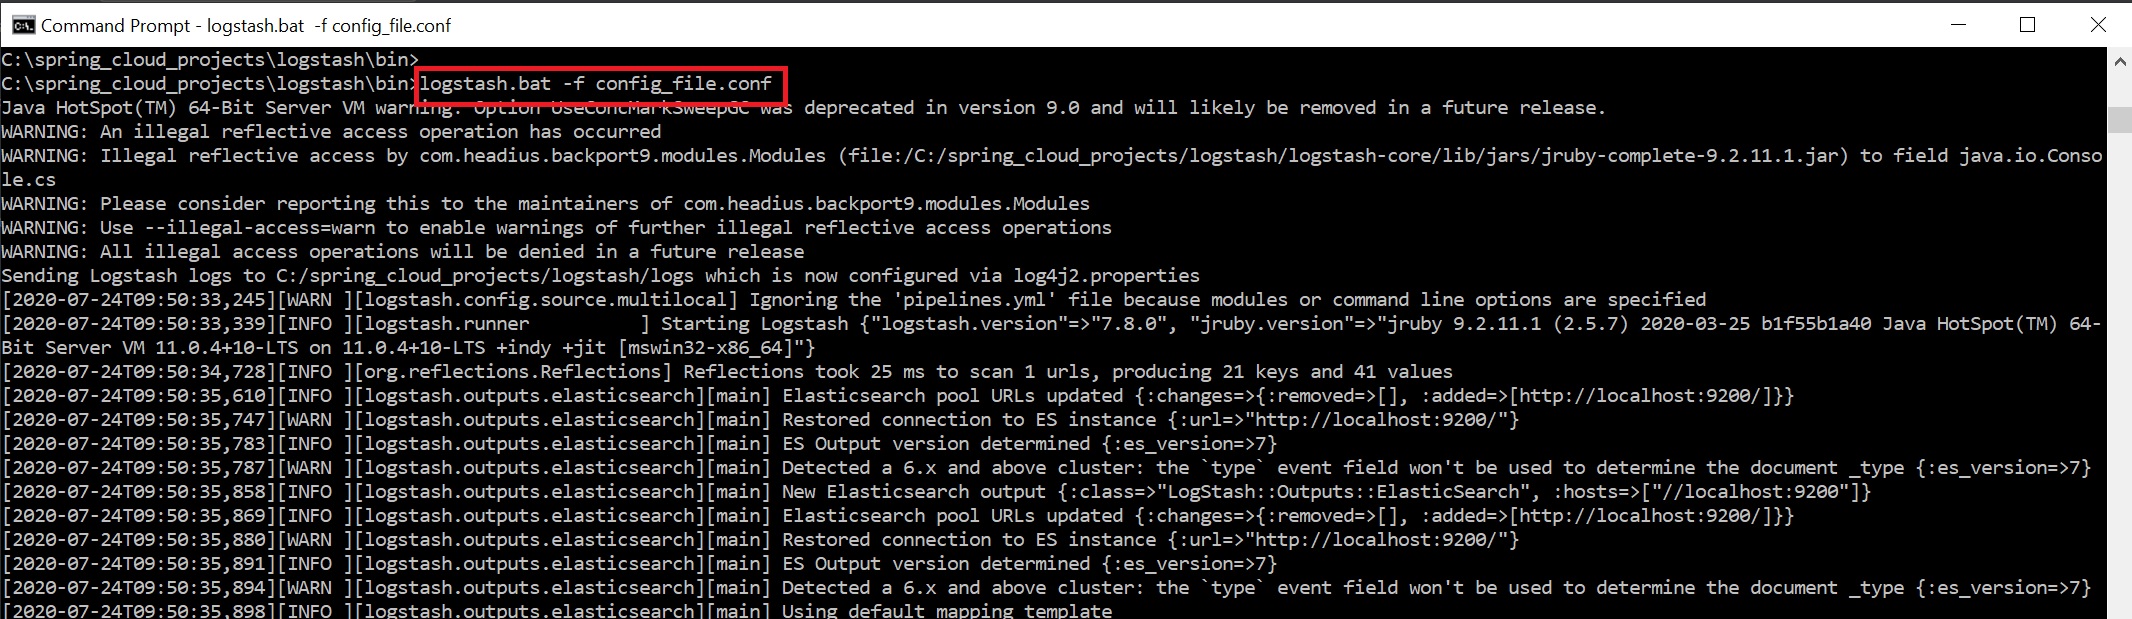
Now start the logstash server using the command logstash.bat -f config_file.conf (I am using windows 10)
Download and start the elasticsearch server using the command elasticsearch.bat

We can open up the elasticsearch application using the http://localhost:9200 and you should see below

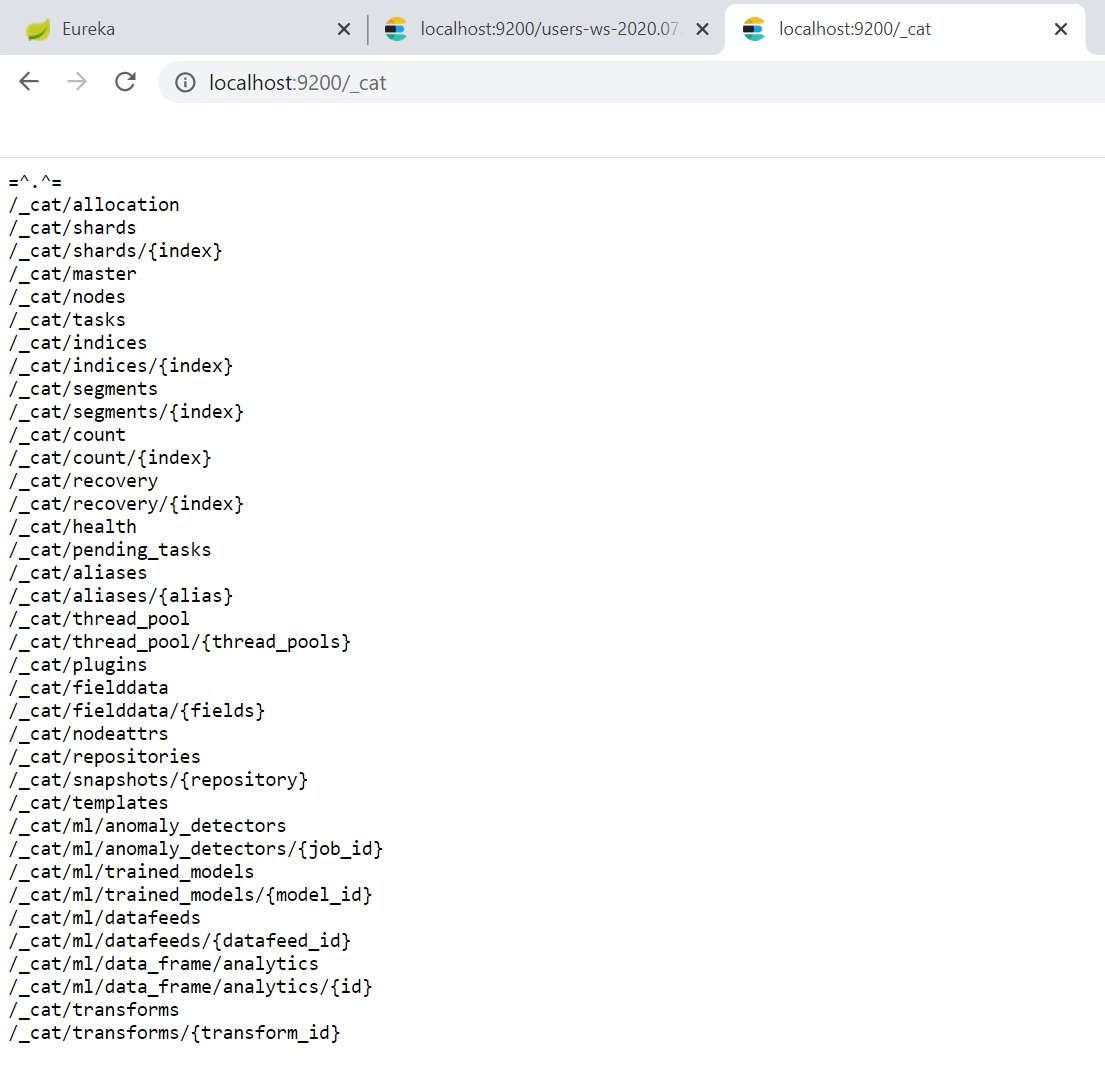
To get a list on what you can do use URL http://localhost:920/_cat
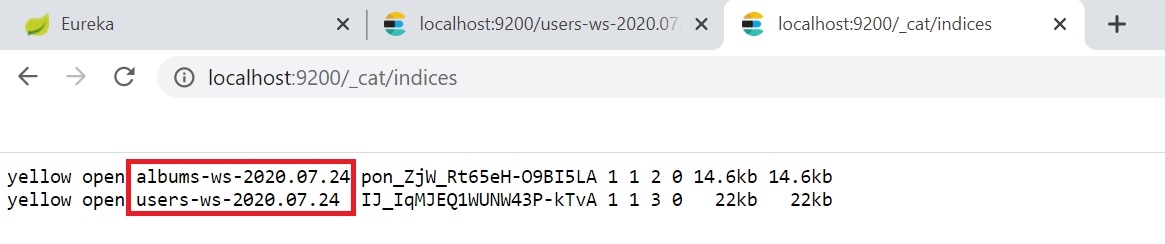
To get a list of the logfiles that are hooked into elasticsearch use the URL http://localhost/_cat/indices
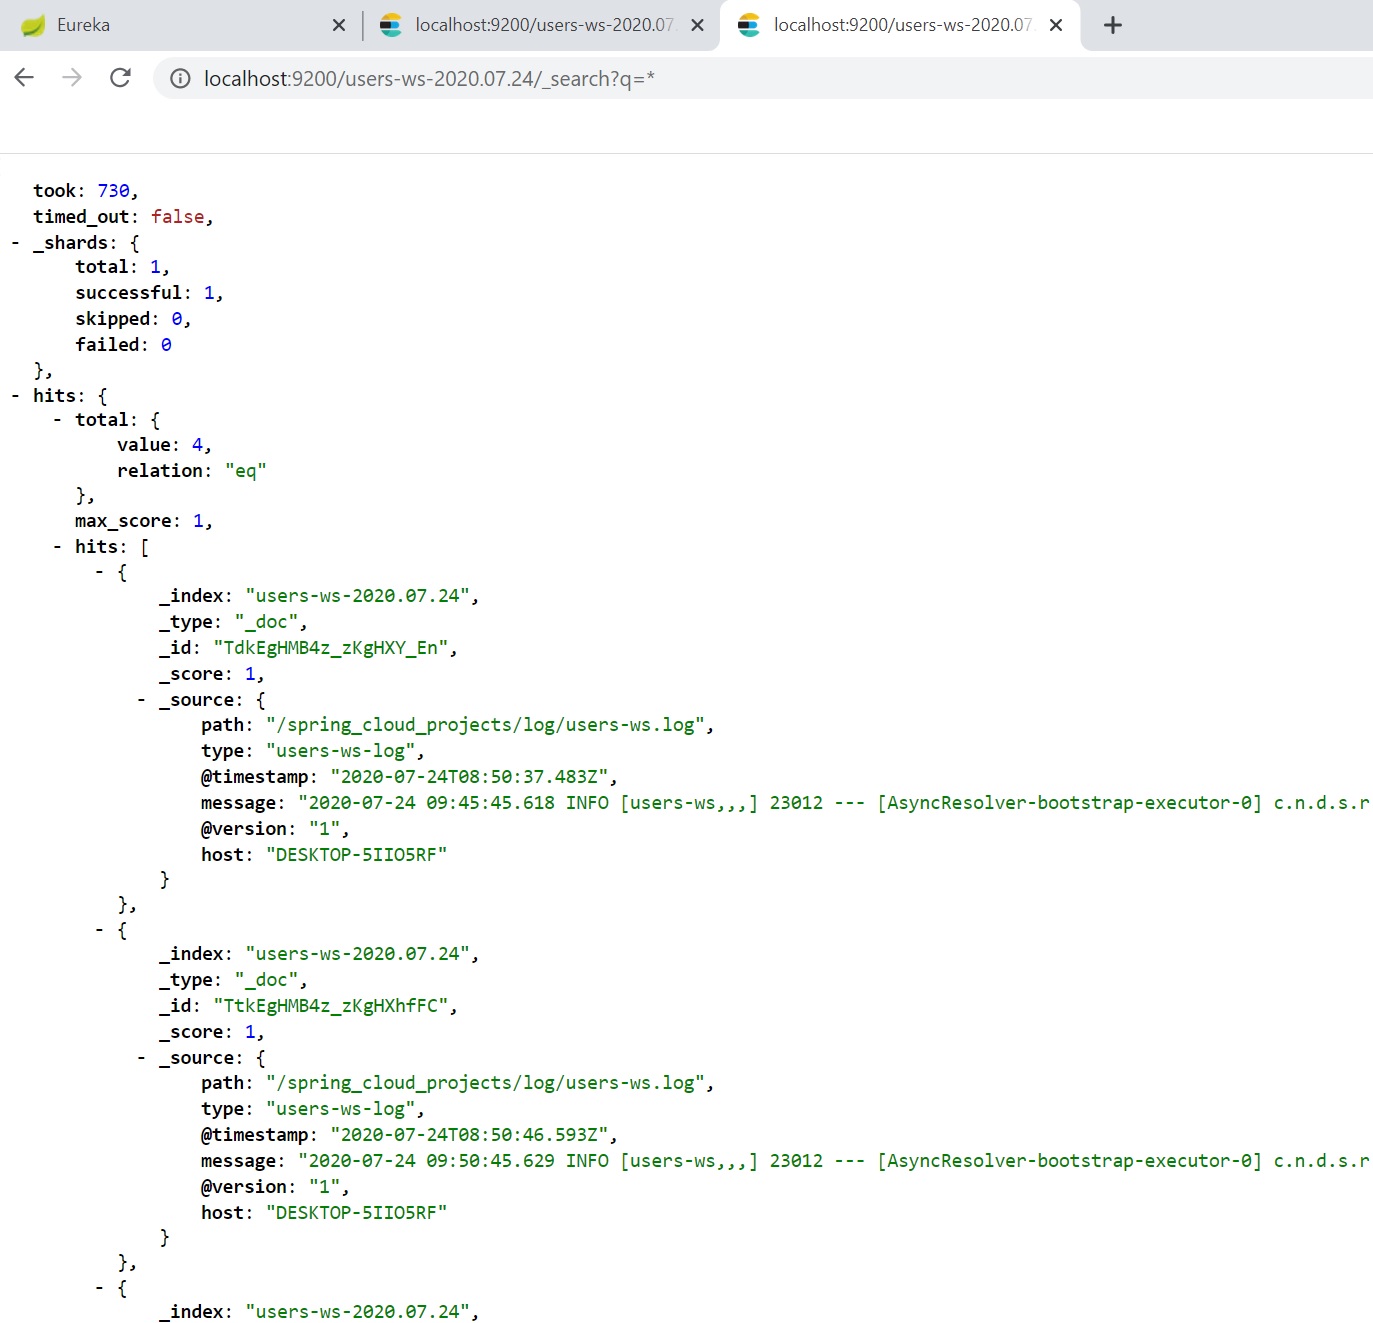
You can use query strings to retrieve the log file information http://localhost:9200/users-ws-<date>/_search?q=*
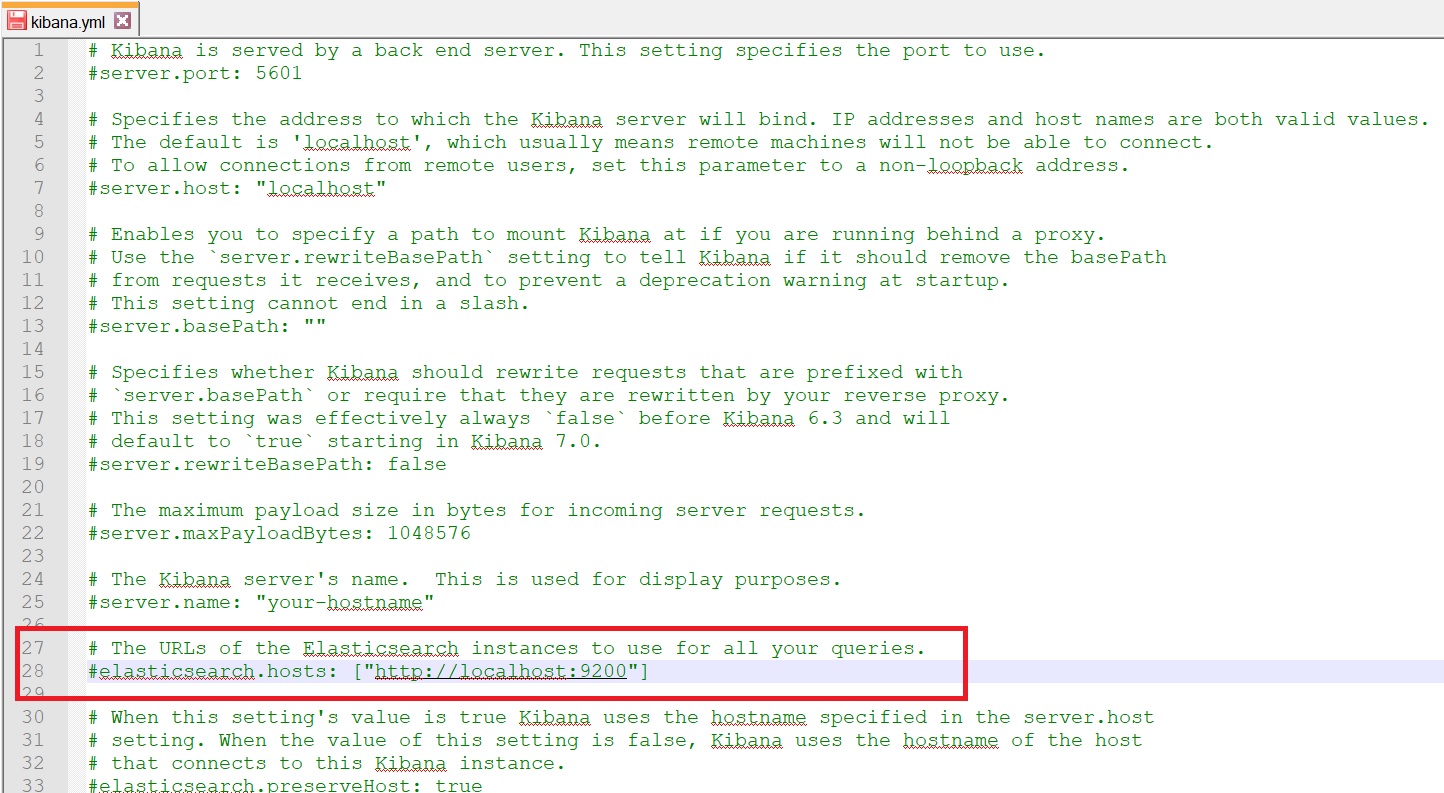
Download Kibana and take a look at the kibabn.yml configuration file, if you have setup elasticsearch on a different port then change it here
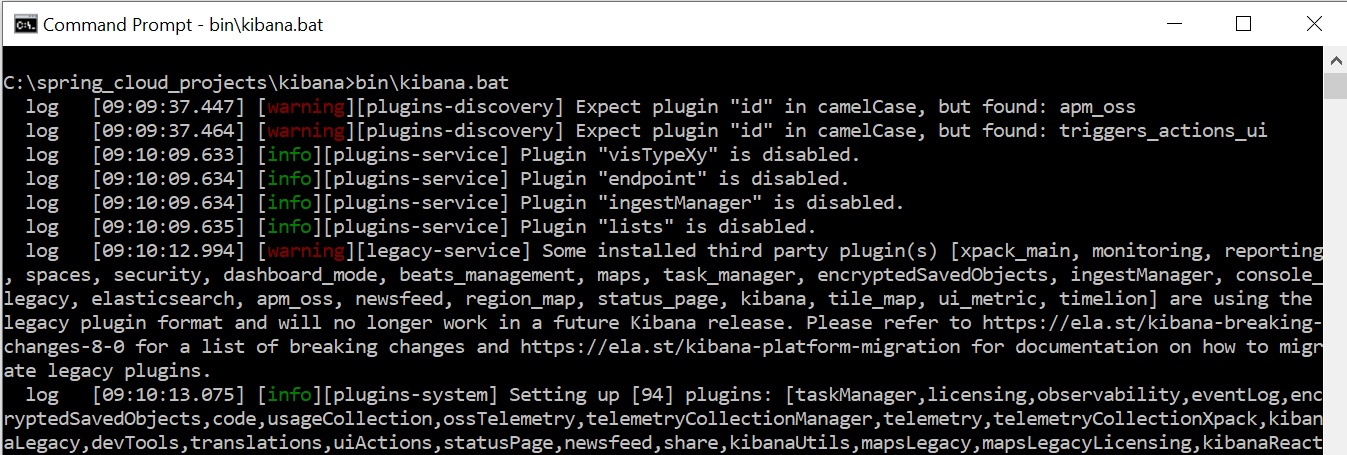
Now start Kibana using kibana.bat
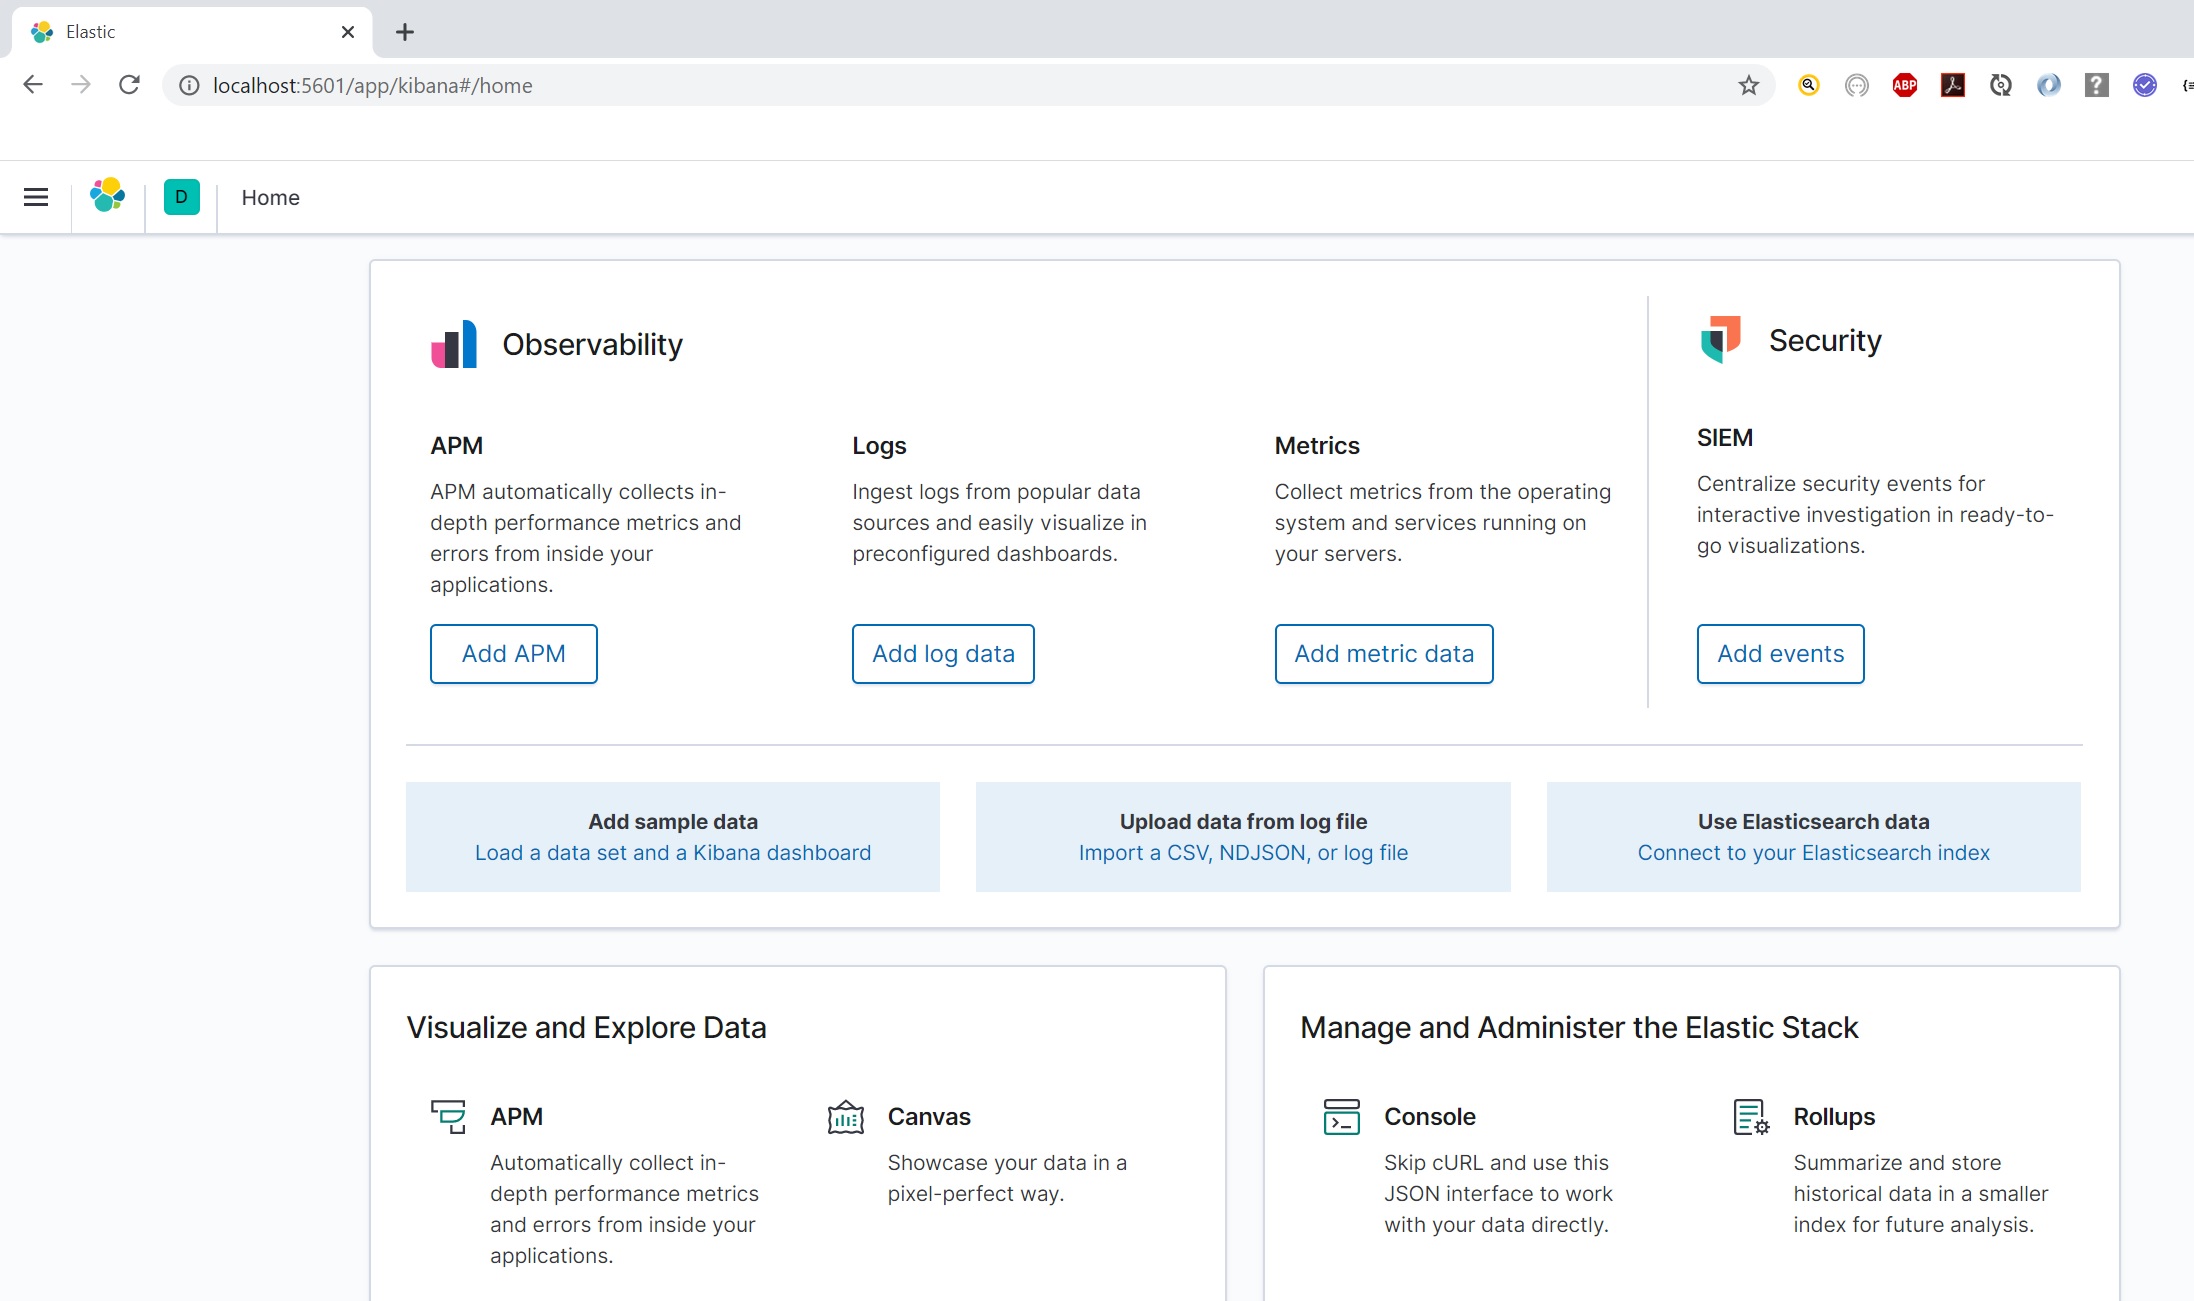
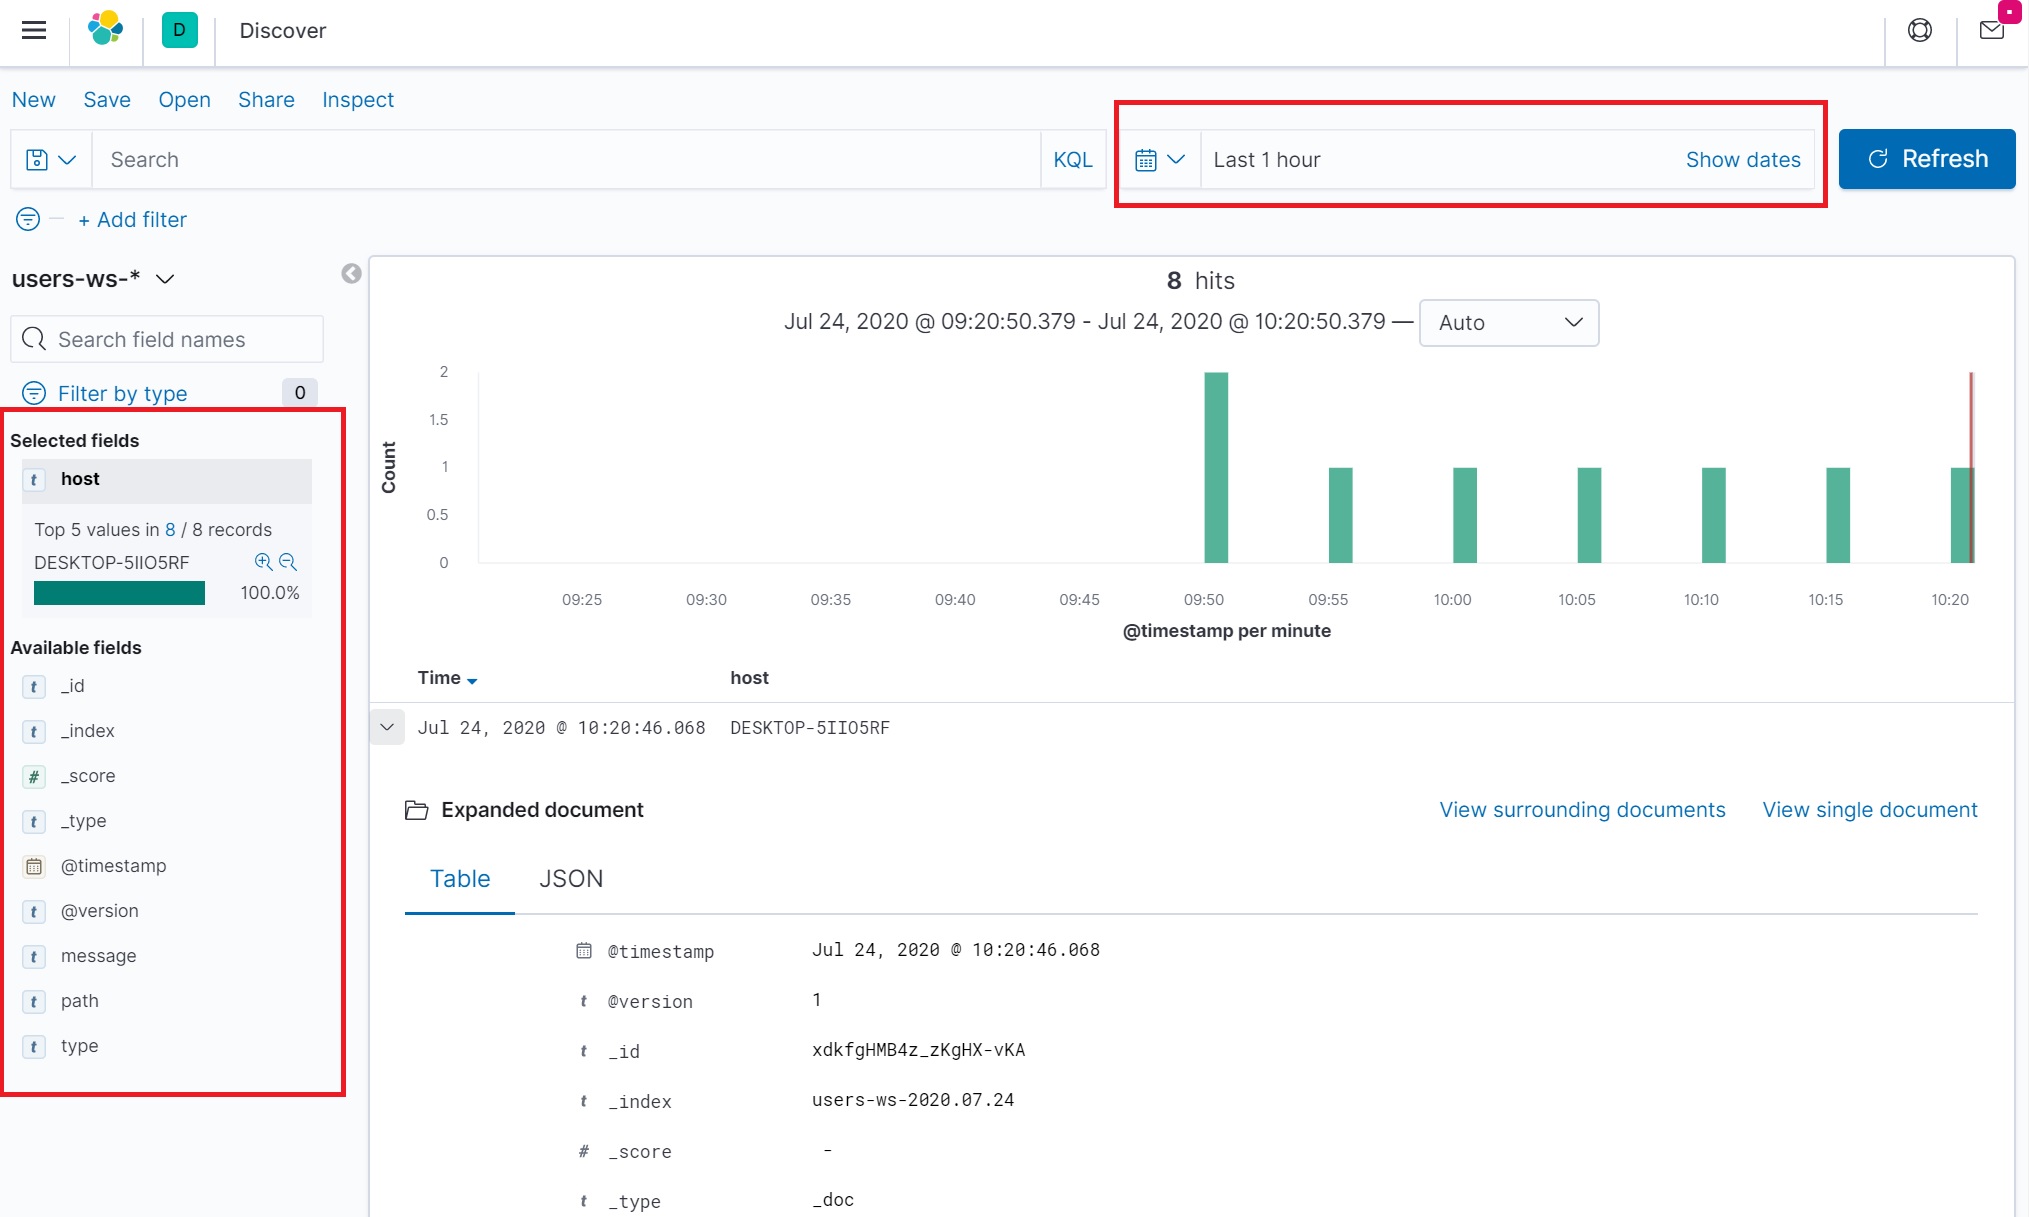
Go to the URL http://localhost:5601 and hopefully you should see the screen below
We create some board index patterns as per below

The select that pattern and the log file information will be retrieved
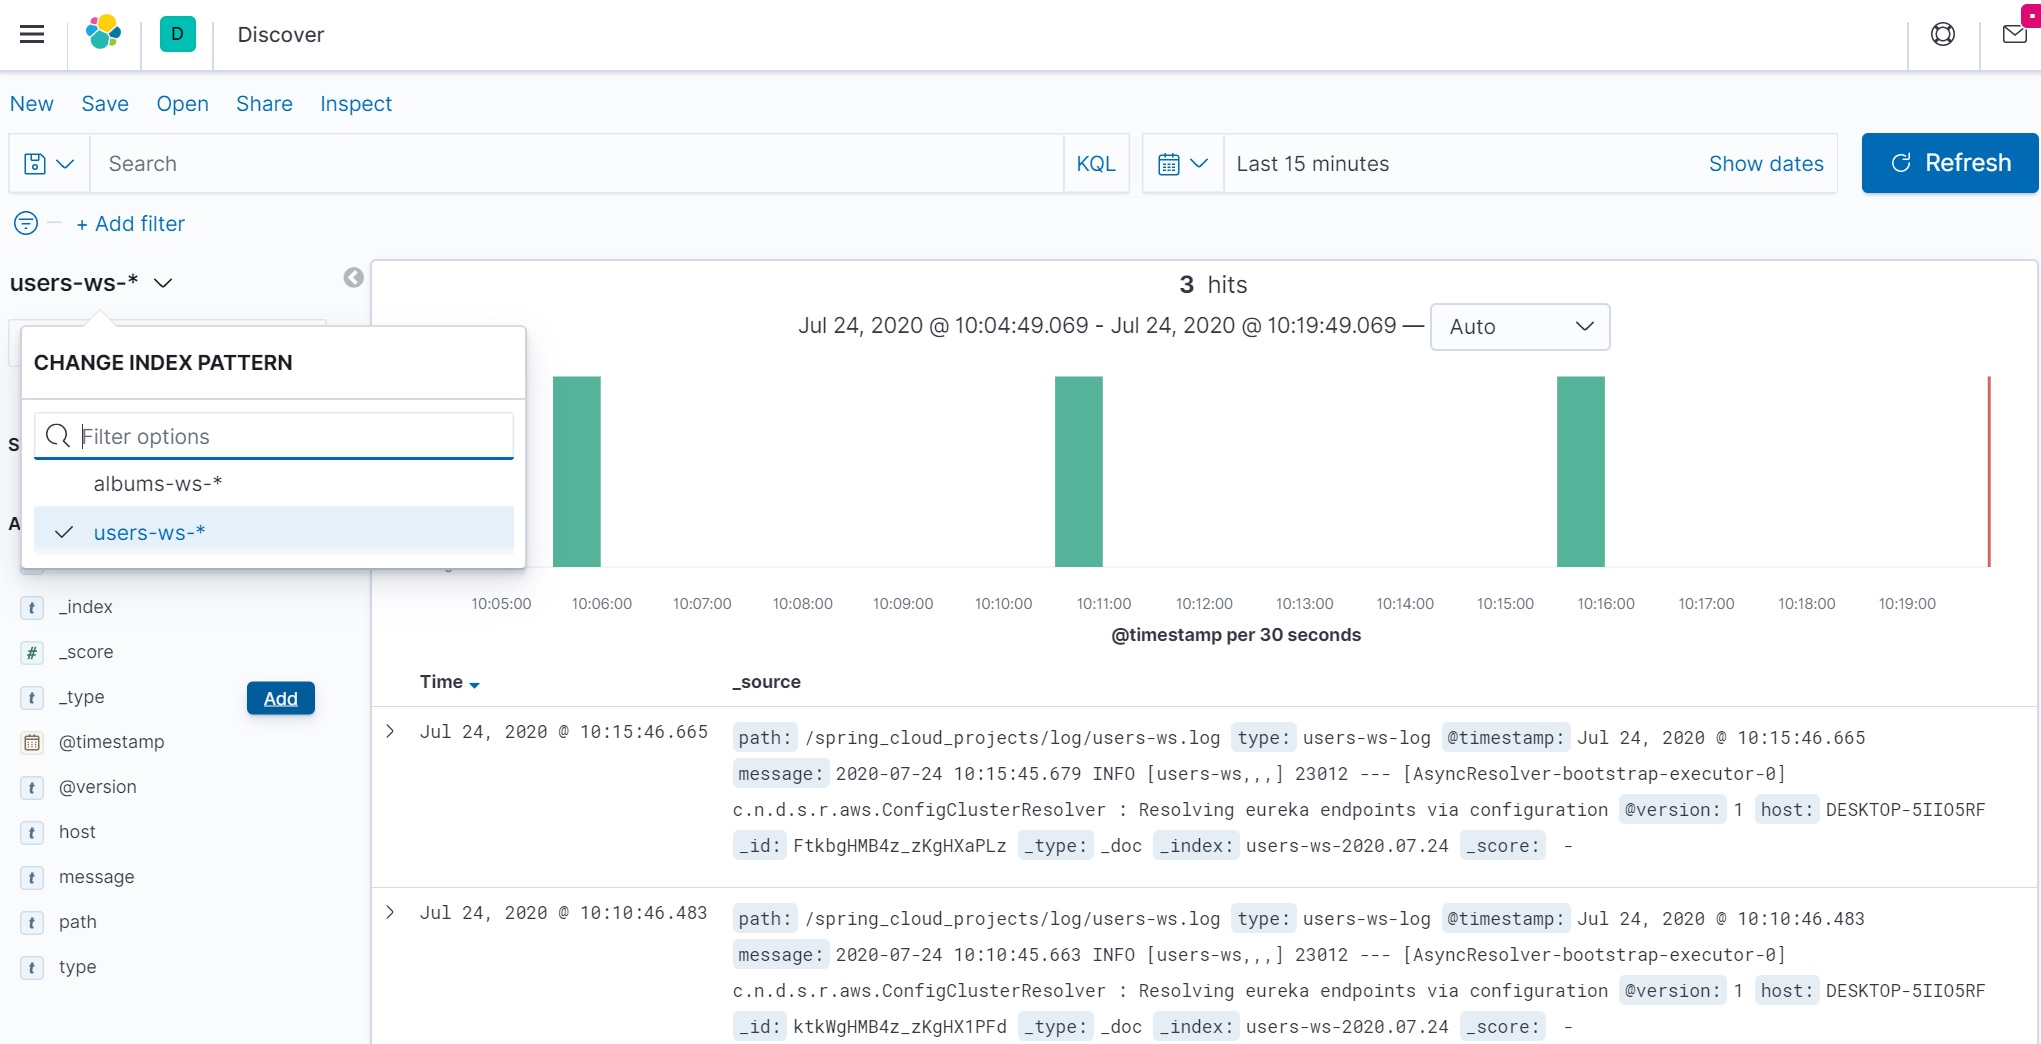
You have the option to filter by fields and search by time as per below
We start by adding the the below dependency to the Eureka Discovery Service

The added the basic username and password properties in the property file.

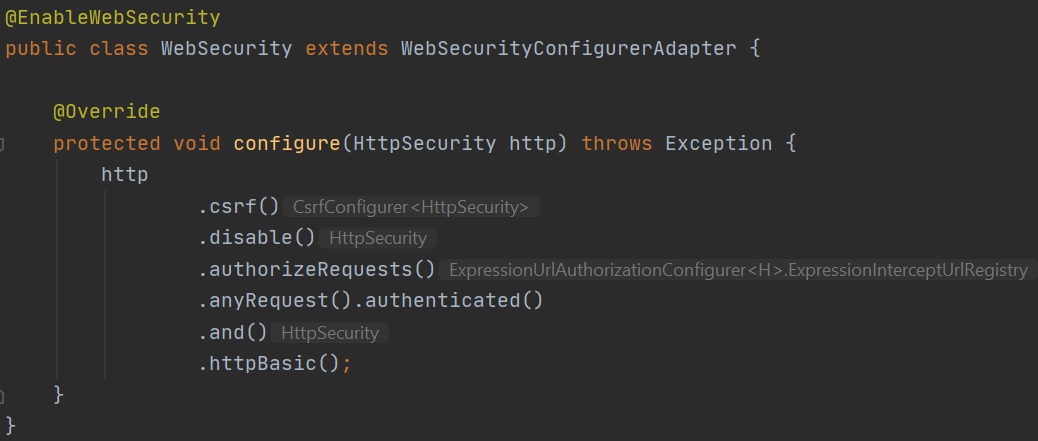
Then we create a basic WebSecurity class file that enables web security and provides a basic login/password utility.
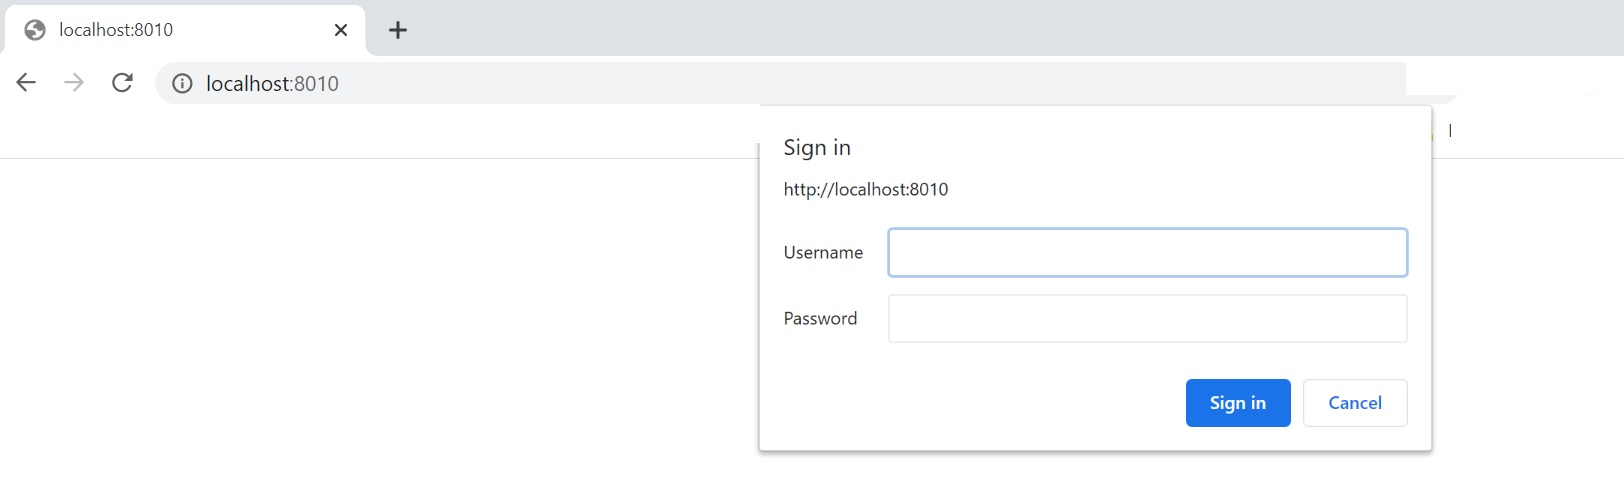
Now when the Eureka Discovery Service starts and you go to the URL you will be requested a username/password
Now each of the microservices need to be updated to add the username and password to the eureka as per below, how this could be moved to config server and you can take advantage of the encrypt/decrypt features to hide the password.