MaxDB Performance
This section will discuss the means and methods for recognizing, analyzing and eliminating performance bottlenecks, we start with discussing how the B* tree structures work and how indexing works in MaxDB
Database performance is affected by the speed of your SQL statements are processed, thus tuning bad SQL queries will enhance the performance. Each SQL query has a cost to execute the statement, the less cost the better tuned the SQL statement resulting in better performance. Expensive SQL example are
The system generates a new execution plan for each request and defines the type of access to the data, it can either scan the entire table or use data structures to accelerate the scanning processing.
Databases are growing to a very large size, keeping all the data in memory is impossible, thus accessing disks decreases system performance. The database optimizer decides on the best strategy that requires the least number of disk accesses.
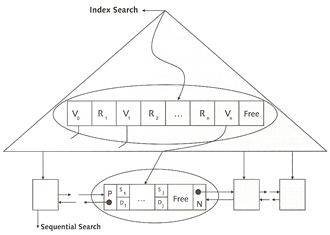
The data structure is a tree, most databases use this structure, it is often referred as the relational database model. B* trees in MaxDB reference real keys, because each node occupies a complete page in the background memory, the system can store many of these reference keys in one node. Real keys are assigned to the data at the lowest level, the leaf level. At this level the system implements another optimization of the data structure for sequential reading, each background memory page contains additional references to the previous and the next page (like a linked list), that means one you have your entry point you just follow the sequential references.
The algorithms for adding and deleting data are always balanced, this means the distance from the root of the tree to any leaf (data record) is always the same.
MaxDb uses B* trees that are directly stored in tables, the tree is created from the bottom (leaf level), this level contains the data records is ascending order according to the primary key. The index level nodes are determined from the values of the leaf level, if the system reaches the end of a page at the leaf level it creates a new entry at the index level.
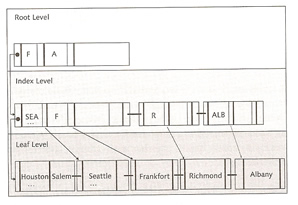
The creation of the primary index continues until all references fit on one page, the root page. If you add data records and the references no longer fit on the page at the root level, the system divides the root page and coverts the resulting pages into index pages to which the root page references. B* tree do have limitations which is restricted to a height of four index levels and one root level.
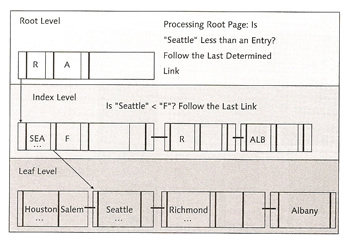
below is a diagram on what happens when you run a query, first it looks in the root page, then gets directed to the index level, if the request is less than the entry then use the last link.
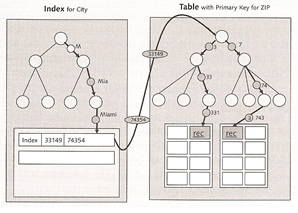
You can also create indexes on additional columns, these are called secondary keys, it would look like something below
The database optimizer is also known as the SQL query optimizer, there are two types
The CBO decides which strategy is used to access the data, the system first determines all possible strategies and their costs which is derived from a number of page accesses, also other things are used
The optimizer uses optimizer statistics only for joins or operations for views to select the appropriate execution strategy. Statistics should be run once a week and can be run manually or automatically.
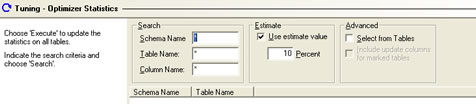
| manually | select instance -> tuning - optimizer statistics, adjust any of the fields to your own requirements
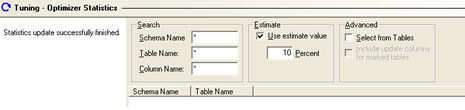
select the green tick (execute) on the main bar and the statistics will be collected, the result will be displayed in the statistics window
you can also use the commandline to update statistics |
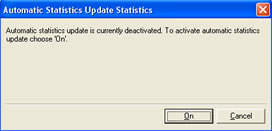
| automatically | select instance -> automatic statistics update, select the on button
|
Caches are used to increase performance, the object is to retrieve data from memory than retrieve from disk, caches allow you to keep recently used data in memory on the chance that it may be require again soon, but there are limitations on the sizes of caches you can create. MaxDB uses three caches
When a region is accessed it is locked against usage by a different user task. Collisions for access to regions lead to wait times until the region is free, thus performance decreases.
Data cache is the largest cache, data is read from disk and held in these caches, changes are made in the cache and a redo log entry is created, from time to time the cache will be flushed to disk, in the event of a system crash the redo entry will be replayed. You need to allocate as much memory as you can to the data cache, although recovery time may be delayed due to the number of redo log entries it does not out weigh the benefits of keep data pages in memory.
The database as you are aware uses only logical pages, automation is required to convert logical pages into physical pages, the converter is responsible for this. The system imports the entire assignment table into the cache when the instance starts, if memory requires increase during operation (new data volumes were added), the I/O buffer cache assigns memory to this cache.
The catalog cache stores SQL information (parsed process, input parameters and output values). You can store each individual users SQL using the sharedsql parameter (set to yes), the catalog cache should have a hit rate > 90%.
The OMS cache is only used in the MaxDB liveCache instance type, it stores and manages data in a heap structure. This structure contains several linked trees. Data is copied to this heap when accessed for the first time, when accessing data this heap is scanned first, if the object is not found then the data cache is scanned. The heap serves as a work center where the data is changed and rewritten to the data cache when a COMMIT is triggered. If using a OMS cache make sure that you give it plenty of memory.
The Log I/O queue stores changes to data as redo entries, these entries are written out to the log volumes, so make sure that the log volumes are on high performance disks, as slow disks will have a negative impact on performance. To increase performance writing to the log volume, the systems caches the redo entries in log queues. The max_log_queue_count parameter defines the maximum number of log queues. You can increase performance further by using the parameter MaxLogWriterTasks, this will increase the number of tasks that will write the entries in the queues to the volume, thus preventing log queue overflows.
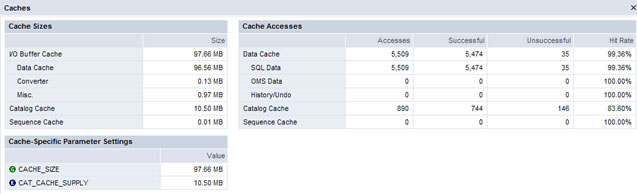
The Database Manager GUI has a view that displays all the caches
| database caches | select instance -> information -> caches
The commandline option is below dbmcli> sql_execute select * from monitor_caches |
MaxDB has a number of tools that can detect performance problems
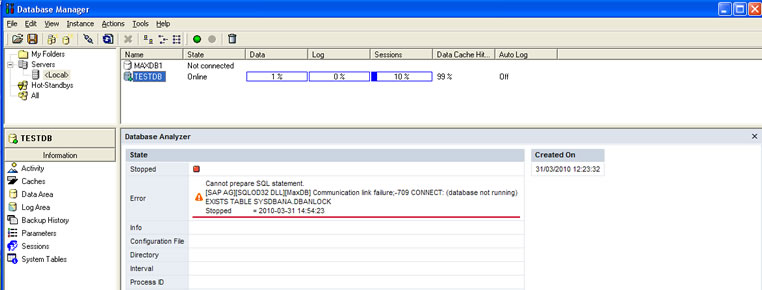
The database analyzer is a great tools for periodically collecting performance information from the system, to start the analyzer follow below
| database analyzer | Select instance -> check -> database analyzer
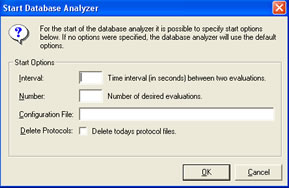
Select the green icon button at the top, then fill in the your requirements, I personally only fill in the interval time of 900 seconds (15 minute intervals)
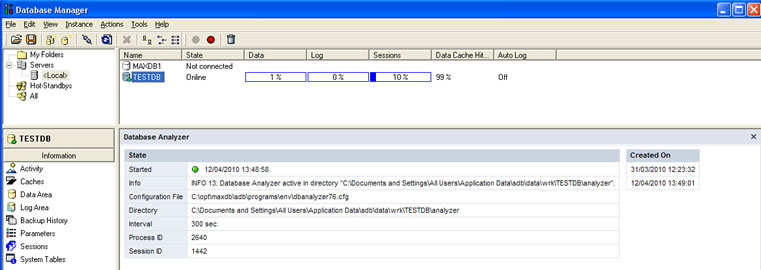
Once the database analyzer is started you should see a screen like below
You can use the commandline (some examples below), use all default values apart from the interval time /opt/sdb/programs/bin/dbanalyzer -t 900 |
The database analyzer has a configuration file that you are welcome to change, I suggest you checkout the SAP website, as I never had a need to change this.
| database analyzer configuration file | /opt/sdb/programs/env/dbanalyzer<version>.cfg This information can also be obtained via the database manager GUI see above |
The analyzer creates a number of output files, mostly cvs files, the location of these files can be obtained via the database manager GUI.
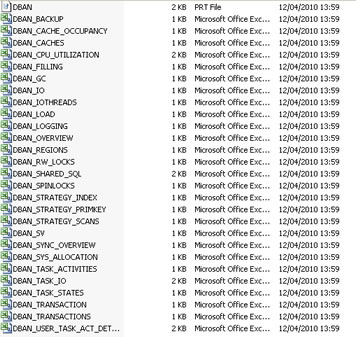
The file to open is the DBAN.prt file, this file is the output of the analyzer report as specified by your interval period. When looking at the log file you will notice a number of abbreviations I, W1 - W3 and E
| I | Information | General information |
| W1 to W3 | Warning levels 1 to 3 | Bottleneck warnings with low, medium and high priority |
| E | Emergency | Critical problems, such as an imminent database crash |
The one thing nice about the database analyzer is that it will help you fix the problem by telling you what should be done on particular warnings, you should then investigate what needs to be done, then implement it. Most of the time the errors will either be memory related or SQL related.
The resource monitor aggregates collected data and implemented SQL queries and thus gives a long term picture of the health of your setup. The resource monitor uses two tables
| SYSCMD_ANALYZE | SQL statements are stored in this table |
| SYSDATA_ANALYZE | This table is linked to the above table and contains the aggregated statement performance information |
You cannot use the database manager GUI to start the resource monitor, you must use the dbmcli command
Resource Monitor |
|
| Starting | ## start the resource monitor (must run this first) dbmcli> sql_execute DIAGNOSE ANALYSIS ON ## start recording of data dbmcli> sql_execute DIAGNOSE ANALYSIS COUNT ON |
| Stopping | ## stop the recording of data (must run this first) dbmcli> sql_execute DIAGNOSE ANALYSIS COUNT OFF ## stop the resource monitor dbmcli> sql_execute DIAGNOSE ANALYSIS OFF |
| Clearing data | ## Clear all data dbmcli> sql_execute DIAGNOSE ANALYSIS CLEAR ALL ## Clear from a particular table dbmcli> sql_execute DIAGNOSE ANALYSIS CLEAR DATA dbmcli> sql_execute DIAGNOSE ANALYSIS CLEAR COMMAND |
| Displaying | dbmcli> sql_execute select * from syscmd_analyze dbmcli> sql_execute select * from sysdata_analyze |
The command monitor is used to find expensive SQL queries from certain periods of time, so for instance you had a SQL query that you think might be bad that runs during your overnight batch, now you don't what you hang around waiting for the query to execute, thus with the command monitor you can specify limits on when to trigger the monitor to run. you can configure when queries
All the above are configurable, and as the command monitor is implemented directly in the kernel, you can only start, configure and stop it using SQL statements, the command monitor uses three tables
| SYSMONITOR | stores performance data of queries that violate the limits configured in the SYSMONITOR table , this table as a limit on the number of entries by default 255. To change the limit see the below command monitor commands |
| SYSPARSEDID | contains the SQL query command and is linked to the above table |
| SYSMONDATA | conations the data values used in the SQL statement this is linked to the above table |
Now on how to use the command monitor, use the dbmlci> sql_execute command with any of the below
Command Monitor |
|
| starting | DIAGNOSE MONITOR DATA ON |
| stopping | DIAGNOSE MONITOR OFF |
| delete entries | DIAGNOSE MONITOR CLEAR |
| increase maximum entries | DIAGNOSE MONITOR ROWNO 3000 |
| situational configurations | DIAGNOSE MONITOR READ 100 |
| query runtime limit | DIAGNOSE MONITOR TIME 5000 |
| selectivity limit | DIAGNOSE MONITOR SELECTIVITY 10000 |
| display | select * from sysmonitor select * from sysparseid select * from sysmondata |
The last analyzer tool is the EXPLAIN statement, now I am not going to go into great detail here as I have covered this in my Oracle section and Oracle SQL optimization section.
The EXPLAIN statement is very straight forward you just place into in front of your SQL query and run it, you will receive back a cost plan back regarding your SQL statement, the object is to reduce the cost plan (better performance) by tuning the SQL statement to use indexes and better join conditions, the lower the cost plan the better, you can also use EXPLAIN VIEW for views. The EXPLAIN is the same with other databases and can be used to tune SQL statements, especially if the statement uses a large amount of resources.
| EXPLAIN | explain select * from finanical_reports where <condition1> and <condition2>............ |
| Previous | Menu | Next |