MaxDB Troubleshooting
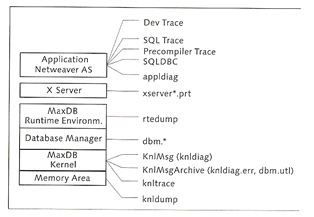
SAP and MaxDB can encounter many problems, knowing where to look can speed up a solution. There are a vast amount of diagnostic files within the SAP system, the diagram below show what files are available
| File | Location | Description |
| Dev Trace (dev_w*) | /usr/sap/<SID>/<instance>/work | written by the disp+work processes of the SAP system, use for connection problems |
| SQL Trace | ST05 (obtained via the SAP GUI) | use to determine SQL performance analysis |
| SQLDBC Trace | <user_home>/.sdb/sqldbctrace<pid>.prt | transaction between SAP netweaver and MaxDB |
| X Server Log | <indep_path>/wrk/xserver_<hostname>.prt | contains error messages that are associated with the X Server |
| appldiag | <indep_path>/wrk/<unix_server>/appldiag | contains communication errors, that have occurred between the application and MaxDB |
| dbm.prt | <indep_path>/wrk/<database_name>|<SID> | contains all commands executed by the database manager. This file is ideal to pickup the commands used to administrate the database |
| knlMsg (knldiag) | <indep_path>/wrk/<database_name>|<SID> | this replaced the knldiag file in newer releases, this contains status information about the database. |
| knlmsgarchive (knldiag.err, dbm.util) | <indep_path>/wrk/<database_name>|<SID> | contains configuration changes, initialization and recovery operations and consistency checks |
| dbm.knl | <indep_path>/wrk/<database_name>|<SID> | log file backup and restores |
| dbm.ebp | <indep_path>/wrk/<database_name>|<SID> | contains information on external backup information (ADSM, Network, BackInt, etc) |
| dbm.ebl | <indep_path>/wrk/<database_name>|<SID> | more of the same as above log file (dbm.ebp) |
| rtedump | <indep_path>/wrk/<database_name>/rtedump_dir | stores system information after a system crash |
| knltrace | <indep_path>/wrk/<database_name>|<SID> | used to analyze database errors and SQL statements, use /opt/sdb/programs/bin/xkernprot to print in readable format |
| knldump | <indep_path>/wrk/<database_name>|<SID> | copy of main memory areas and is automatically created in the event of a system crash, have to view via the database manager (binary file) |
I mentioned the kernel trace file above but did not explain how to use it,
Kernel Tracing |
|
| Activate | dbmcli> trace_on default |
| Deactivate | dbmcli> trace_off default |
| Flush | dbmcli> trace_flush |
| Extract the data | /opt/sdb/programs/bin/xkernprot -d <database> <trace_output> |
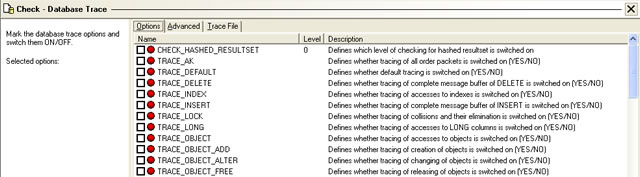
| database manager GUI | instance -> check -> database trace
Note: you still need to view the data via the xkernprot command |
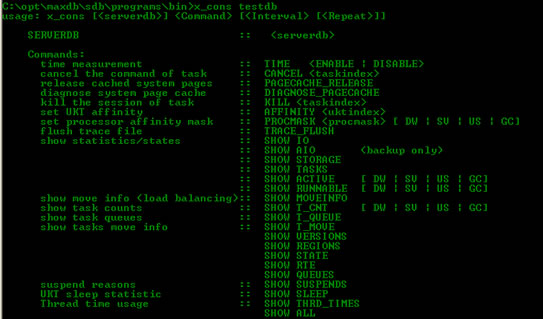
The x_cons utility is a great little tool that I use all the time, it helps you understand what is going on within the systems at any point in time, I have a snapshot of all the commands that you can use
x_cons |
|
| all commands |
|
| SHOW IO | shows stats on access to the volumes |
| SHOW AIO | shows stats on access to the volumes (backups only) |
| SHOW STORAGE | shows memory consumption and the task stack |
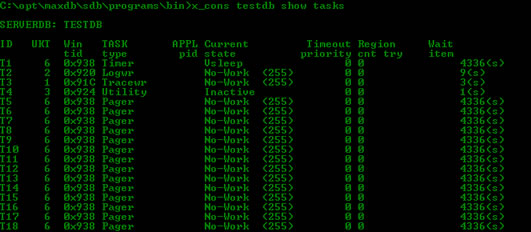
| SHOW TASKS | show task statistics (see above display output) |
| SHOW ACTIVE | shows active tasks |
| SHOW RUNNABLE | show information on executable tasks |
| SHOW T_CNT | detailed information on specific tasks |
| SHOW T_QUEUE | show task queues |
| STATE | shows the operational state of the database |
| RTE | show the runtime environment |
| QUEUES | shows the queues |
| ALL | shows all the information above and much more |
Here are some useful tools
| xinstinfo | |
| sdbregview |
## list all the install MaxDB components sdbregview -l ## list all the MaxDB component files sdbregview -f |
I also have a section on performance problems take a look at this section as well.
| Previous | Menu |